
| Name: LAGE3 | Sequence: fasta or formatted (143aa) | NCBI GI: 24430137 | |
|
Description: L antigen family, member 3
|
Referenced in:
| ||
|
Composition:
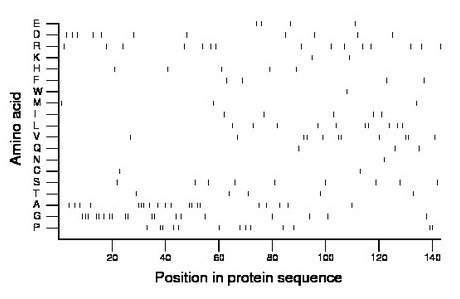
Amino acid Percentage Count Longest homopolymer A alanine 14.0 20 3 C cysteine 1.4 2 1 D aspartate 7.7 11 1 E glutamate 2.8 4 1 F phenylalanine 2.8 4 1 G glycine 13.3 19 3 H histidine 3.5 5 1 I isoleucine 3.5 5 1 K lysine 1.4 2 1 L leucine 7.0 10 2 M methionine 2.1 3 1 N asparagine 0.7 1 1 P proline 9.1 13 2 Q glutamine 2.1 3 1 R arginine 10.5 15 1 S serine 6.3 9 1 T threonine 3.5 5 1 V valine 7.7 11 2 W tryptophan 0.7 1 1 Y tyrosine 0.0 0 0 |
Comparative genomics:
Search single species RefSeq proteins at NCBI
Search summary 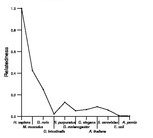
Figure data | ||
Related human proteins:Protein Relative score Description Self-match 1.000 L antigen family, member 3 CTAG1B 0.216 cancer/testis antigen 1B CTAG1A 0.216 cancer/testis antigen 1A CTAG2 0.179 cancer/testis antigen 2 isoform LAGE-1a CTAG2 0.108 cancer/testis antigen 2 isoform LAGE-1b NKX1-1 0.049 PREDICTED: HPX-153 homeobox SOX4 0.045 SRY (sex determining region Y)-box 4 NKX1-1 0.045 PREDICTED: NK1 homeobox 1 TRIO 0.045 triple functional domain (PTPRF interacting) INSM1 0.041 insulinoma-associated 1 GDF7 0.041 growth differentiation factor 7 preproprotein COL1A1 0.037 alpha 1 type I collagen preproprotein MARCKS 0.037 myristoylated alanine-rich protein kinase C substra... LRCH2 0.037 leucine-rich repeats and calponin homology (CH) dom... PCDH7 0.037 protocadherin 7 isoform c precursor JMY 0.037 junction-mediating and regulatory protein CCDC85C 0.034 coiled-coil domain containing 85C FOXQ1 0.034 forkhead box Q1 SMAD7 0.034 SMAD family member 7 LOC100130360 0.034 PREDICTED: hypothetical protein HECA 0.034 headcase FOXD2 0.034 forkhead box D2 KCNQ3 0.030 potassium voltage-gated channel KQT-like protein 3 [H... ZSWIM6 0.030 zinc finger, SWIM-type containing 6 SCRT1 0.030 scratch ARID1B 0.030 AT rich interactive domain 1B (SWI1-like) isoform 2 ... ARID1B 0.030 AT rich interactive domain 1B (SWI1-like) isoform 1 ... ARID1B 0.030 AT rich interactive domain 1B (SWI1-like) isoform 3 ... LOC100289949 0.030 PREDICTED: hypothetical protein XP_002346877 EOMES 0.026 eomesoderminHuman BLASTP results (used to prepare the table) | |||
Gene descriptions are from NCBI RefSeq. Search results were obtained with NCBI BLAST and RefSeq entries. When identical proteins are present, the self-match may not be listed first in BLASTP output. In such cases, the table above has been reordered to place it first.
See About the Figures for the scoring system used in the figure above right. The same scoring system was used in the table of BLASTP results.
Guide to the Human Genome
Copyright © 2010 by Stewart Scherer. All rights reserved.
