
| Name: CCDC18 | Sequence: fasta or formatted (1417aa) | NCBI GI: 62243484 | |
|
Description: sarcoma antigen NY-SAR-41
|
Referenced in:
| ||
|
Composition:
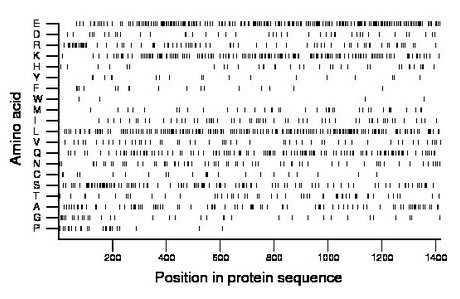
Amino acid Percentage Count Longest homopolymer A alanine 6.2 88 2 C cysteine 1.6 22 2 D aspartate 3.1 44 2 E glutamate 15.1 214 3 F phenylalanine 1.3 18 1 G glycine 2.8 39 2 H histidine 2.5 35 2 I isoleucine 4.4 62 2 K lysine 10.6 150 3 L leucine 12.2 173 2 M methionine 2.7 38 1 N asparagine 4.5 64 3 P proline 1.6 22 1 Q glutamine 9.1 129 5 R arginine 5.4 77 3 S serine 8.0 114 4 T threonine 3.7 53 2 V valine 3.7 53 1 W tryptophan 0.3 4 1 Y tyrosine 1.3 18 2 |
Comparative genomics:
Search single species RefSeq proteins at NCBI
Search summary 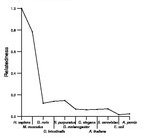
Figure data | ||
Related human proteins:Protein Relative score Description Self-match 1.000 sarcoma antigen NY-SAR-41 CENPE 0.068 centromere protein E GOLGA4 0.067 golgi autoantigen, golgin subfamily a, 4 EEA1 0.066 early endosome antigen 1, 162kD MYH9 0.066 myosin, heavy polypeptide 9, non-muscle CEP250 0.062 centrosomal protein 2 MYH10 0.060 myosin, heavy polypeptide 10, non-muscle MYH3 0.060 myosin, heavy chain 3, skeletal muscle, embryonic [H... GOLGB1 0.059 golgi autoantigen, golgin subfamily b, macrogolgin ... MYH13 0.058 myosin, heavy polypeptide 13, skeletal muscle [Homo... MYH11 0.058 smooth muscle myosin heavy chain 11 isoform SM1A [Ho... MYH11 0.058 smooth muscle myosin heavy chain 11 isoform SM1B [Ho... MYH11 0.058 smooth muscle myosin heavy chain 11 isoform SM2B [Ho... MYH11 0.058 smooth muscle myosin heavy chain 11 isoform SM2A [Ho... GCC2 0.058 GRIP and coiled-coil domain-containing 2 CENPF 0.057 centromere protein F PLEC1 0.056 plectin 1 isoform 11 PLEC1 0.056 plectin 1 isoform 10 PLEC1 0.056 plectin 1 isoform 8 PLEC1 0.056 plectin 1 isoform 7 PLEC1 0.056 plectin 1 isoform 6 PLEC1 0.056 plectin 1 isoform 3 PLEC1 0.056 plectin 1 isoform 2 PLEC1 0.056 plectin 1 isoform 1 NUMA1 0.056 nuclear mitotic apparatus protein 1 CCDC88A 0.053 coiled-coil domain containing 88A isoform 2 CCDC88A 0.053 coiled-coil domain containing 88A isoform 1 MYH6 0.052 myosin heavy chain 6 MYH7 0.052 myosin, heavy chain 7, cardiac muscle, beta CEP290 0.051 centrosomal protein 290kDaHuman BLASTP results (used to prepare the table) | |||
Gene descriptions are from NCBI RefSeq. Search results were obtained with NCBI BLAST and RefSeq entries. When identical proteins are present, the self-match may not be listed first in BLASTP output. In such cases, the table above has been reordered to place it first.
See About the Figures for the scoring system used in the figure above right. The same scoring system was used in the table of BLASTP results.
Guide to the Human Genome
Copyright © 2010 by Stewart Scherer. All rights reserved.
