
| Name: LOC100294080 | Sequence: fasta or formatted (339aa) | NCBI GI: 239509054 | |
|
Description: PREDICTED: similar to RAB19, member RAS oncogene family
| Not currently referenced in the text | ||
|
Composition:
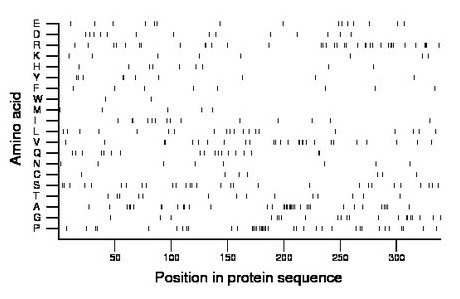
Amino acid Percentage Count Longest homopolymer A alanine 10.6 36 4 C cysteine 2.1 7 1 D aspartate 4.1 14 1 E glutamate 4.4 15 1 F phenylalanine 2.4 8 1 G glycine 6.2 21 2 H histidine 2.7 9 1 I isoleucine 4.1 14 2 K lysine 2.4 8 1 L leucine 5.9 20 1 M methionine 1.5 5 1 N asparagine 2.4 8 1 P proline 11.2 38 6 Q glutamine 5.3 18 2 R arginine 10.6 36 3 S serine 8.6 29 2 T threonine 4.1 14 1 V valine 8.0 27 2 W tryptophan 0.6 2 1 Y tyrosine 2.9 10 2 |
Comparative genomics:
Search single species RefSeq proteins at NCBI
Search summary 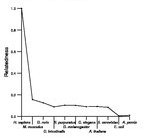
Figure data | ||
Related human proteins:Protein Relative score Description Self-match 1.000 PREDICTED: similar to RAB19, member RAS oncogene fa... LOC100292485 0.547 PREDICTED: hypothetical protein LOC100287491 0.547 PREDICTED: hypothetical protein LOC100287491 0.547 PREDICTED: hypothetical protein XP_002342841 RAB19 0.158 RAB19, member RAS oncogene family RAB43 0.119 RAB43 protein RAB30 0.096 RAB30, member RAS oncogene family RAB26 0.090 RAB26, member RAS oncogene family RAB1A 0.089 RAB1A, member RAS oncogene family isoform 1 RAB1B 0.086 RAB1B, member RAS oncogene family RAB2B 0.086 RAB2B protein isoform 2 RAB2B 0.086 RAB2B protein isoform 1 RAB37 0.086 RAB37, member RAS oncogene family isoform 2 RAB37 0.086 RAB37, member RAS oncogene family isoform 3 RAB18 0.084 RAB18, member RAS oncogene family RAB2A 0.084 RAB2A, member RAS oncogene family RAB12 0.084 RAB12, member RAS oncogene family RAB11B 0.081 RAB11B, member RAS oncogene family RAB11A 0.081 Ras-related protein Rab-11A RAB4B 0.080 ras-related GTP-binding protein 4b RAB3C 0.078 RAB3C, member RAS oncogene family RAB25 0.078 RAB25 RAB8A 0.078 mel transforming oncogene RAB14 0.078 GTPase Rab14 RAB4A 0.077 RAB4A, member RAS oncogene family RAB3A 0.077 RAB3A, member RAS oncogene family RAB8B 0.077 RAB8B, member RAS oncogene family RAB22A 0.075 RAS-related protein RAB-22A RAB3B 0.074 RAB3B, member RAS oncogene family RAB31 0.074 RAB31, member RAS oncogene familyHuman BLASTP results (used to prepare the table) | |||
Gene descriptions are from NCBI RefSeq. Search results were obtained with NCBI BLAST and RefSeq entries. When identical proteins are present, the self-match may not be listed first in BLASTP output. In such cases, the table above has been reordered to place it first.
See About the Figures for the scoring system used in the figure above right. The same scoring system was used in the table of BLASTP results.
Guide to the Human Genome
Copyright © 2010 by Stewart Scherer. All rights reserved.
