
| Name: MIPOL1 | Sequence: fasta or formatted (442aa) | NCBI GI: 23503325 | |
|
Description: mirror-image polydactyly 1
|
Referenced in: Additional Genes in Development
| ||
|
Composition:
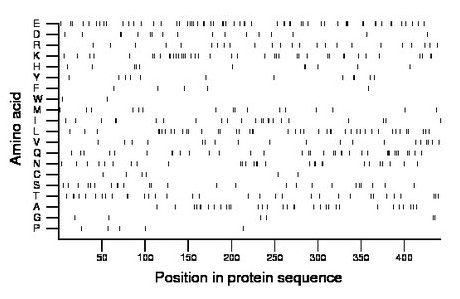
Amino acid Percentage Count Longest homopolymer A alanine 7.2 32 2 C cysteine 1.4 6 1 D aspartate 3.8 17 2 E glutamate 13.6 60 3 F phenylalanine 1.1 5 1 G glycine 1.4 6 1 H histidine 2.5 11 2 I isoleucine 5.2 23 2 K lysine 9.0 40 2 L leucine 9.7 43 2 M methionine 3.6 16 1 N asparagine 6.3 28 2 P proline 1.1 5 1 Q glutamine 7.9 35 3 R arginine 5.4 24 1 S serine 5.7 25 2 T threonine 7.5 33 2 V valine 4.3 19 1 W tryptophan 0.5 2 1 Y tyrosine 2.7 12 2 |
Comparative genomics:
Search single species RefSeq proteins at NCBI
Search summary 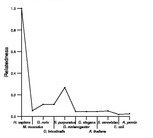
Figure data | ||
Related human proteins:Protein Relative score Description Self-match 1.000 mirror-image polydactyly 1 MYH9 0.049 myosin, heavy polypeptide 9, non-muscle TPM4 0.047 tropomyosin 4 isoform 1 MYH11 0.047 smooth muscle myosin heavy chain 11 isoform SM1A [Ho... MYH11 0.047 smooth muscle myosin heavy chain 11 isoform SM1B [Ho... MYH11 0.047 smooth muscle myosin heavy chain 11 isoform SM2B [Ho... MYH11 0.047 smooth muscle myosin heavy chain 11 isoform SM2A [Ho... CENPF 0.047 centromere protein F CCDC150 0.047 coiled-coil domain containing 150 KTN1 0.047 kinectin 1 isoform b KTN1 0.047 kinectin 1 isoform a KTN1 0.047 kinectin 1 isoform c KTN1 0.047 kinectin 1 isoform a TPM1 0.047 tropomyosin 1 alpha chain isoform 3 GOLGB1 0.047 golgi autoantigen, golgin subfamily b, macrogolgin ... TPM3 0.047 tropomyosin 3 isoform 1 TPM4 0.045 tropomyosin 4 isoform 2 TPM3 0.045 tropomyosin 3 isoform 5 CCDC88A 0.045 coiled-coil domain containing 88A isoform 2 CCDC88A 0.045 coiled-coil domain containing 88A isoform 1 TPM2 0.044 tropomyosin 2 (beta) isoform 1 MYH10 0.044 myosin, heavy polypeptide 10, non-muscle PLEC1 0.044 plectin 1 isoform 11 PLEC1 0.044 plectin 1 isoform 10 PLEC1 0.044 plectin 1 isoform 8 PLEC1 0.044 plectin 1 isoform 7 PLEC1 0.044 plectin 1 isoform 6 PLEC1 0.044 plectin 1 isoform 3 PLEC1 0.044 plectin 1 isoform 2 PLEC1 0.044 plectin 1 isoform 1Human BLASTP results (used to prepare the table) | |||
Gene descriptions are from NCBI RefSeq. Search results were obtained with NCBI BLAST and RefSeq entries. When identical proteins are present, the self-match may not be listed first in BLASTP output. In such cases, the table above has been reordered to place it first.
See About the Figures for the scoring system used in the figure above right. The same scoring system was used in the table of BLASTP results.
Guide to the Human Genome
Copyright © 2010 by Stewart Scherer. All rights reserved.
