
| Name: NAT10 | Sequence: fasta or formatted (1025aa) | NCBI GI: 221316723 | |
|
Description: N-acetyltransferase 10 isoform a
|
Referenced in: Histones, Related Proteins, and Modifying Enzymes
| ||
Other entries for this name:
alt prot [953aa] N-acetyltransferase 10 isoform b | |||
|
Composition:
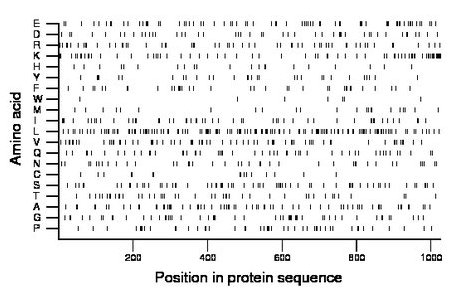
Amino acid Percentage Count Longest homopolymer A alanine 7.1 73 3 C cysteine 1.6 16 2 D aspartate 5.0 51 2 E glutamate 7.0 72 2 F phenylalanine 3.5 36 1 G glycine 5.2 53 3 H histidine 2.2 23 2 I isoleucine 5.2 53 2 K lysine 7.1 73 2 L leucine 13.2 135 3 M methionine 2.3 24 1 N asparagine 3.8 39 1 P proline 4.6 47 2 Q glutamine 5.1 52 2 R arginine 5.7 58 3 S serine 6.5 67 2 T threonine 4.6 47 4 V valine 6.6 68 3 W tryptophan 0.7 7 1 Y tyrosine 3.0 31 2 |
Comparative genomics:
Search single species RefSeq proteins at NCBI
Search summary 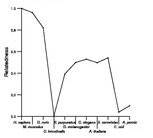
Figure data | ||
Related human proteins:Protein Relative score Description Self-match 1.000 N-acetyltransferase 10 isoform a NAT10 0.929 N-acetyltransferase 10 isoform b CEP152 0.008 centrosomal protein 152kDa RAD50 0.007 RAD50 homolog isoform 2 RAD50 0.007 RAD50 homolog isoform 1 MAP1B 0.007 microtubule-associated protein 1B EIF2AK4 0.006 eukaryotic translation initiation factor 2 alpha kin... ANKRD12 0.006 ankyrin repeat domain 12 isoform 2 ANKRD12 0.006 ankyrin repeat domain 12 isoform 1 SFRS12IP1 0.006 P18SRP protein MPHOSPH8 0.006 M-phase phosphoprotein 8 CLIP1 0.005 restin isoform b CLIP1 0.005 restin isoform a LOC100294364 0.005 PREDICTED: hypothetical protein HYDIN 0.005 hydrocephalus inducing isoform a RABEP1 0.005 rabaptin, RAB GTPase binding effector protein 1 isof... EIF2S2 0.005 eukaryotic translation initiation factor 2 beta [Hom... BIN1 0.005 bridging integrator 1 isoform 4 BIN1 0.005 bridging integrator 1 isoform 8 FILIP1 0.005 filamin A interacting protein 1 CD276 0.005 CD276 antigen isoform a CD276 0.005 CD276 antigen isoform b LOC100133599 0.005 PREDICTED: hypothetical protein LOC100294088 0.004 PREDICTED: hypothetical protein, partial MYH10 0.004 myosin, heavy polypeptide 10, non-muscle TCERG1 0.004 transcription elongation regulator 1 isoform 2 [Homo... TCERG1 0.004 transcription elongation regulator 1 isoform 1 [Homo... GNL2 0.004 guanine nucleotide binding protein-like 2 (nucleolar)... ROCK1 0.004 Rho-associated, coiled-coil containing protein kinase... RAI14 0.004 retinoic acid induced 14 isoform dHuman BLASTP results (used to prepare the table) | |||
Gene descriptions are from NCBI RefSeq. Search results were obtained with NCBI BLAST and RefSeq entries. When identical proteins are present, the self-match may not be listed first in BLASTP output. In such cases, the table above has been reordered to place it first.
See About the Figures for the scoring system used in the figure above right. The same scoring system was used in the table of BLASTP results.
Guide to the Human Genome
Copyright © 2010 by Stewart Scherer. All rights reserved.
