
| Name: ANO1 | Sequence: fasta or formatted (986aa) | NCBI GI: 194306539 | |
|
Description: anoctamin 1, calcium activated chloride channel
|
Referenced in:
| ||
|
Composition:
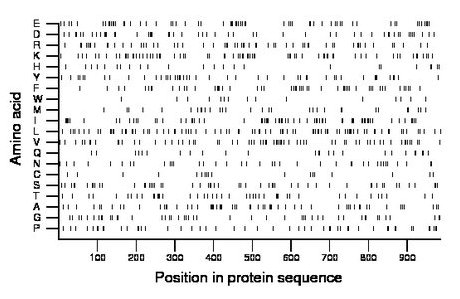
Amino acid Percentage Count Longest homopolymer A alanine 6.3 62 3 C cysteine 1.8 18 1 D aspartate 5.2 51 2 E glutamate 6.9 68 5 F phenylalanine 5.3 52 2 G glycine 4.9 48 2 H histidine 2.5 25 2 I isoleucine 6.9 68 2 K lysine 7.4 73 2 L leucine 8.9 88 2 M methionine 3.2 32 1 N asparagine 4.0 39 2 P proline 5.0 49 2 Q glutamine 2.7 27 2 R arginine 6.1 60 2 S serine 5.6 55 2 T threonine 4.5 44 2 V valine 6.7 66 2 W tryptophan 1.5 15 1 Y tyrosine 4.7 46 1 |
Comparative genomics:
Search single species RefSeq proteins at NCBI
Search summary 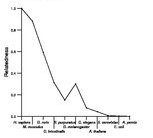
Figure data | ||
Related human proteins:Protein Relative score Description Self-match 1.000 anoctamin 1, calcium activated chloride channel [Ho... ANO2 0.572 anoctamin 2 ANO4 0.334 anoctamin 4 ANO3 0.309 transmembrane protein 16C ANO5 0.305 anoctamin 5 isoform b ANO5 0.305 anoctamin 5 isoform a ANO6 0.281 anoctamin 6 isoform b ANO6 0.281 anoctamin 6 isoform a ANO6 0.271 anoctamin 6 isoform c ANO6 0.271 anoctamin 6 isoform c ANO7 0.260 transmembrane protein 16G isoform NGEP long ANO9 0.197 tumor protein p53 inducible protein 5 ANO10 0.052 transmembrane protein 16K ANO8 0.032 anoctamin 8 LOC645634 0.027 PREDICTED: hypothetical protein LOC645634 0.027 PREDICTED: hypothetical protein LOC645634 0.027 PREDICTED: hypothetical protein WDR87 0.005 NYD-SP11 protein LOC100294088 0.005 PREDICTED: hypothetical protein, partial FAM124A 0.004 hypothetical protein LOC220108 LOC400352 0.004 PREDICTED: similar to Putative golgin subfamily A m... LOC100132816 0.004 PREDICTED: similar to Putative golgin subfamily A m... CHAF1A 0.004 chromatin assembly factor 1, subunit A (p150) DDX60 0.004 DEAD (Asp-Glu-Ala-Asp) box polypeptide 60 TCHH 0.003 trichohyalin PALMD 0.003 palmdelphin ZNF434 0.003 zinc finger protein 434 AKD1 0.003 adenylate kinase domain containing 1 isoform 1 [Hom... TOP1 0.003 DNA topoisomerase I ZNF148 0.003 zinc finger protein 148Human BLASTP results (used to prepare the table) | |||
Gene descriptions are from NCBI RefSeq. Search results were obtained with NCBI BLAST and RefSeq entries. When identical proteins are present, the self-match may not be listed first in BLASTP output. In such cases, the table above has been reordered to place it first.
See About the Figures for the scoring system used in the figure above right. The same scoring system was used in the table of BLASTP results.
Guide to the Human Genome
Copyright © 2010 by Stewart Scherer. All rights reserved.
