
| Name: EPC1 | Sequence: fasta or formatted (836aa) | NCBI GI: 13376810 | |
|
Description: enhancer of polycomb 1
|
Referenced in: Histones, Related Proteins, and Modifying Enzymes
| ||
|
Composition:
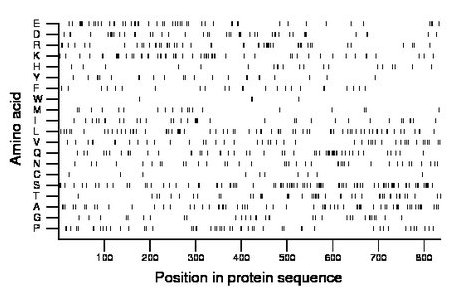
Amino acid Percentage Count Longest homopolymer A alanine 7.7 64 4 C cysteine 1.2 10 1 D aspartate 5.3 44 2 E glutamate 6.2 52 3 F phenylalanine 2.9 24 1 G glycine 4.1 34 2 H histidine 2.5 21 2 I isoleucine 4.2 35 2 K lysine 6.6 55 3 L leucine 8.5 71 3 M methionine 2.4 20 1 N asparagine 4.8 40 2 P proline 6.0 50 1 Q glutamine 6.8 57 4 R arginine 6.0 50 3 S serine 10.9 91 4 T threonine 5.5 46 2 V valine 5.4 45 2 W tryptophan 0.5 4 1 Y tyrosine 2.8 23 2 |
Comparative genomics:
Search single species RefSeq proteins at NCBI
Search summary 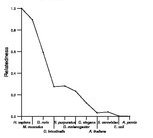
Figure data | ||
Related human proteins:Protein Relative score Description Self-match 1.000 enhancer of polycomb 1 EPC2 0.480 enhancer of polycomb homolog 2 BRD1 0.013 bromodomain containing protein 1 BRPF3 0.012 bromodomain and PHD finger containing, 3 PHF17 0.012 PHD finger protein 17 long isoform TOX3 0.011 TOX high mobility group box family member 3 isoform... TOX3 0.011 TOX high mobility group box family member 3 isoform... BRPF1 0.010 bromodomain and PHD finger-containing protein 1 isof... BRPF1 0.010 bromodomain and PHD finger-containing protein 1 isof... DNAJC9 0.009 DnaJ homolog, subfamily C, member 9 MUC12 0.009 PREDICTED: mucin 12 LOC645202 0.009 PREDICTED: hypothetical protein LOC645202 MN1 0.008 meningioma 1 PHF15 0.008 PHD finger protein 15 EP400 0.008 E1A binding protein p400 MUC4 0.007 mucin 4 isoform a LOC100131514 0.007 PREDICTED: similar to hCG1747327, partial SPZ1 0.007 spermatogenic leucine zipper 1 C14orf4 0.007 chromosome 14 open reading frame 4 LOC727832 0.007 golgi autoantigen, golgin subfamily a-like FOXP2 0.007 forkhead box P2 isoform I FOXP2 0.007 forkhead box P2 isoform III FOXP2 0.007 forkhead box P2 isoform II MAML2 0.007 mastermind-like 2 MUC21 0.007 mucin 21 MUC17 0.007 mucin 17 MLL2 0.007 myeloid/lymphoid or mixed-lineage leukemia 2 LOC100294236 0.006 PREDICTED: similar to diffuse panbronchiolitis crit... THAP11 0.006 THAP domain containing 11 LRRIQ1 0.006 leucine-rich repeats and IQ motif containing 1 isof...Human BLASTP results (used to prepare the table) | |||
Gene descriptions are from NCBI RefSeq. Search results were obtained with NCBI BLAST and RefSeq entries. When identical proteins are present, the self-match may not be listed first in BLASTP output. In such cases, the table above has been reordered to place it first.
See About the Figures for the scoring system used in the figure above right. The same scoring system was used in the table of BLASTP results.
Guide to the Human Genome
Copyright © 2010 by Stewart Scherer. All rights reserved.
