
Gene Families
When examining gene families, there are several basic approaches to seeing how the family has evolved: the presence of related genes in other species, the degree of conservation of sequence or domain structure among the family members, and the dispersion of the family on the chromosomes. There is a considerable degree of local synteny among the mammals. If a large gene family has become largely dispersed among the chromosomes, it may indicate a much earlier origin for those genes. Homologs in invertebrates and microbes provide information about the central role of certain genes and families in the function of cells and in development.Although many human proteins are encoded by gene families, it is important to remember that some human proteins have little or no similarity to any other protein encoded by a functional gene. Examples are readily found in many areas of metabolism including the heme, pentose phosphate, and sialic acid pathways.
Notable patterns of gene organization
The evolution of new genes by duplication and divergence is reflected in the frequent linkage of family members. In some cases, the linkage reflects more recent evolution. In others, functional constraints result in linkage of older gene family members. Examples detailed elsewhere include the globin and HOX genes. The text includes chromosome maps for several gene families with varying degrees of clustering combined with dispersed members. The photoreceptors are another interesting family with linked and unlinked members.The following table describes the linkage relationships for members of some other small, intensively studied gene families. Family members may retain similar function but have different patterns of expression. In other cases, members have distinct functions. The gene numbers are from the reference genome sequence. Variation in gene number among individuals is known for amylase. Pseudogenes are not included in those counts. Note how proteins with exceptional conservation such as actin and calmodulin are encoded by dispersed families.
| Distribution of Gene Families on the Chromosomes | |||
|---|---|---|---|
| Gene family | Gene count | Chromosomes | Additional information |
| Calmodulin | 3 | 2, 14, 19 | identical protein sequences, many other related proteins |
| Enolase | 3 | 1, 12, 17 | |
| Actinins | 4 | 1, 11, 14, 19 | |
| Notch | 4 | 1, 6, 9, 19 | also smaller related protein on chromosome 1 |
| Amylase | 5 | 1 | cluster spans about 205 kb, also pseudogene |
| G β subunits | 5 | 1, 7, 9, 12, 15 | |
| Actin | 6 | 1, 2, 7, 10, 15, 17 | also highly similar ACTBL2 and many other related proteins |
| Polycomb PCGF | 6 | 2, 4, 10 (3), 17 | three genes on chromosome 10 not closely linked |
| Alcohol dehydrogenase | 7 | 4 | cluster spans about 365 kb |
| Metallothioneins | 11 | 16 | cluster spans about 120 kb, also related genes / pseudogenes |
Even with linked families, certain cases are of special interest. Perhaps the most extreme are the rearranging families that encode the antigen receptors on B cells and T cells. As shown in the following table, while occupying considerable DNA segments, these loci would not rank among the very largest human genes. Also of interest is the presence of trypsin genes in the T-cell receptor β locus. In the table, sizes are rounded to the nearest 0.01 Mb.
| Rearranging Loci in the Immune System | ||
|---|---|---|
| Locus | Chromosome | Size (Mb) |
| T cell α / δ | 14 | 0.93 |
| T cell β | 7 | 0.58 |
| T cell γ | 7 | 0.13 |
| Ig heavy chain | 14 | 1.23 |
| Ig κ | 2 | 0.97 |
| Ig λ | 22 | 0.88 |
In other cases, a common carboxy-terminal segment is joined to variable amino-terminal sequences via alternate splicing. Two well-studied cases are protocadherin families and the UGT1 family in xenobiotic metabolism.
It is rare for genes unrelated by sequence but related by function to be clustered. One interesting example is found with functions related to the neurotransmitter acetylcholine.
For additional information on the proteins encoded in the mitochondrial genome, see Oxidative Phosphorylation.
The X and Y chromosomes
Much can be learned about the origins of the Y chromosome by comparison of its genes to those found on the X. Several classes of genes are found on the Y chromosome. One type is found in the pseudoautosomal regions with essentially identical proteins encoded on the X chromosome. A second group is specific to the Y chromosome. SRY, a gene in this second group, is part of a large family with members on other chromosomes. Y-specific genes also are found as families on the Y chromosome (see the section on Y-linked genes). The following table describes members of a third class where closely related family members are found at dispersed locations on the much larger X chromosome. Some of the X-linked copies from this third class have been found to escape X inactivation in females.
| Related Genes on the X and Y Chromosomes | ||
|---|---|---|
| Y / X gene pair | Function | Section |
| AMELY / AMELX | amelogenin | Bone and Related Tissues |
| DDX3Y / DDX3X | helicase | DEAD / H Helicase Family |
| EIF1AY / EIF1AX | initiation factor | Translation Factors |
| NLGN4Y / NLGN4X | neuroligin 4 | Neurons |
| PCDH11Y / PCDH11X | protocadherin | Cadherins and Related Proteins |
| RPS4Y1 RPS4Y2 / RPS4X | ribosomal protein | Ribosomes |
| KDM5D / KDM5C | PHD Finger Proteins | |
| TBL1Y / TBL1X | WD Repeat Proteins | |
| TGIF2LY / TGIF2LX | Homeobox and Related Proteins | |
| TMSB4Y / TMSB4X | thymosin β 4 | Cytoskeleton |
| USP9Y USP9X | ubiquitin-specific protease | Ubiquitin and Related Protein Modifications |
| UTY / KDM6A (UTX) | Tetratricopeptide Domains | |
| VCY family / VCX family | Testes and Sperm | |
| ZFY / ZFX | Krüppel-related Zinc Finger Proteins | |
The genes listed in the table above may have additional transcripts and isoforms. Not included in the table is the XK gene family, which has members on the X, on the Y, and elsewhere in the genome. CYorf15A and CYorf15B are also related to a gene on the X. The RBMY genes also are related to RBMX. PRKY (related to PRKX) is now considered a pseudogene.
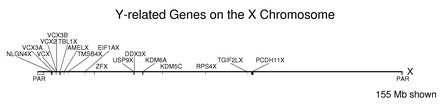
The following figure shows the locations on the X chromosome of the genes from the table of Y / X pairs above. Note how the counterparts of the Y-linked genes are found along the larger X chromosome. The size shown is for the X chromosome. The Y chromosome is 57.8 Mb in length with about half in a single unsequenced block (see section on the chromosomes). The pseudoautosomal regions at the telomeres are labeled PAR below the chromosome. These regions cover about 2% of the X chromosome. Many of the genes shown in the figure are close to the larger PAR at the left end of the X (but note that four of these are from the VCX family). When these locations are compared with the positions of the corresponding genes on the Y chromosome, the gene order is largely scrambled.
Very large gene families
The human genome encodes a number of very large families whose members perform very similar functions. Among these are the olfactory receptors and histone families. Of note in the histone families are a few more divergent members with specialized functions. Both of these families have complex patterns of organization on the chromosomes.In many cases, members of sequence families are more divergent. These families may contain a highly conserved domain or a smaller consensus sequence. In other cases, often in smaller families, the encoded proteins may interact with a common partner or with each other.
Protein families with conserved domains
Unlike the families mentioned in the preceding section, other large protein families are identified via conserved domains rather than conservation of overall structure. For example, ring-finger-containing proteins form a very large family. The section Domain Structure of Proteins describes the assembly of conserved domains into larger proteins.Trancription factors can be grouped into families via their conserved domains. Most of these are presented in the chapter on Development. Of note is the very large number of genes with Krüppel-type zinc fingers.
Large gene families often have notable subfamilies. Separating these genes into functional groups is not always straightforward. Examples in other sections include the receptor and nonreceptor protein tyrosine phosphatases and the Ser/Thr and tyrosine protein kinases.
Consensus sequences in protein families
Large families of conserved proteins or domains enable the identification of important residues via consensus sequences. As can be seen with the interferons, more divergent family members are helpful in defining these regions. The text presents a number of local multiple alignments including sulfatases, bromodomain proteins, WW repeat family, cyclooxygenases and peroxidases, DEAD helicases, ubiquitin-specific proteases, homeobox proteins, POU domain family, and helix-loop-helix transcription factors.In some cases, conserved residues do vary among family members. One example is seen with ERAS (see Stem Cells and Early Development). Sometimes, mutant alleles of one family member introduce residues seen in wild-type alleles of other family members. This is observed with the MEFV gene (see Tripartite Motif Family).
Shared subunits and protein complexes
Instead of having a common domain, the members of a protein family can form complexes with a common subunit. One well-known case involves the glycoprotein hormones (see Pituitary).Another is the group of receptors that use the β subunit of the IL3 receptor (see Interleukins and Their Receptors).
Among metabolic enzymes, the α subunit of succinyl-CoA synthetase interacts with two different β subunits with different nucleotide preferences (see TCA Cycle).
Famiilies of interacting proteins
It is not unusual to find sequence similarity among subunits of a protein complex. One well-studied family includes subunits of the nicotinic acetylcholine receptor. Another involves subunits of the proteasome. Other examples are seen in some of the subunits of the CD3 complex associated with the T-cell receptor and subunits of the membrane attack complex (see Complement). Similar relationships can be seen among subunits of DNA replication factor C (see Replication Proteins), with the neurofilament proteins (see Neurons) and among subunits of the MCM complex (also described with Replication Proteins).The semaphorins and plexins are families of ligands and receptors that also have some sequence similarity to each other.
Tissue-specific isoforms
Some human genes are ubiquitously expressed; others are tightly restricted to a single cell type or tissue. It is common for genes to be highly expressed in a combination of organs in the body. In other sections, proteins are listed as being notably expressed in a particular tissue. In some cases, this is related to where the protein was first identified. Often, a protein may be more widely expressed, but the absence of expression of other family members makes it a dominant form in a particular part of the body.Metabolic enzymes are frequently encoded by single-copy genes and have little or no overall sequence similarity to other enzymes. A number of enzymes are encoded by distinct, related genes where one is expressed in muscle and the other in liver. Many examples are found in glycolysis and glycogen metabolism. Other pathways, such as the TCA cycle, generally lack such tissue-specific forms.
Brain and testes have many examples of tissue-specific isoforms of proteins. Some are the products of alternate splicing, whereas others derive from separate genes. NOS1 (brain nitric oxide synthase) is in a gene family with two other members. A number of proteins first identified at synapses have been found to be parts of gene families with members expressed in a variety of tissues.
Organelle-specific isoforms
A number of reactions of the TCA cycle and associated pathways also occur in the cytoplasm. In some cases, the enzymes use NADP rather than NAD. Some of these situations involve small families of closely related genes, whereas others use quite different proteins.Both mitochondria and peroxisomes have β-oxidation pathways for fatty acids. Mechanistic and structural differences are seen in the enzymes of these related pathways.
Despite the obvious similarities in function, the cytoplasmic and mitochondrial ribosomal proteins generally share very little sequence similarity. A similar but more complex picture is seen with the cytoplasmic and mitochondrial aminoacyl-tRNA synthetases.
Gene families and development
There are many cases of human gene families where different members with very similar functions are expressed at distinct times in development. Some examples described in other sections include the ADH1 family (see Alcohol and Aldehyde Dehydrogenases), the β-globin family (see Oxygen Sensing and Hemoglobin) and the steroid 5-α reductases (see Steroid Hormones). An important special case is class switching at the immunoglobulin heavy chain locus (see B cells).Gene families and enzyme substrate specificity
Drug development often involves the discovery of compounds that distinguish among the protein products of gene families. For some important examples of such protein families, see Common Drug Targets. These include the cyclooxygenases in prostaglandin synthesis and the cGMP phosphodiesterases.The adenylate and guanylate cyclases are a notable example of a gene family with varying sequence similarity and substrate specificity. Fatty acid synthesis and oxidation provide several examples of gene families that have evolved to handle different chain lengths and other substrate differences.
Families of ligands and receptors
In a number of cases, cell surface receptors and their ligands are both members of gene families. These situations can lead to complex patterns of binding observed in various assays. An interesting case is the C-C and C-X-C chemokines and their receptors. In both cases the ligand genes are more numerous than their receptors. Ligands also outnumber the receptors in the α- / β-type interferons and the IL1 and IL10 receptor families (IL10 family receptors are related to the interferon receptors).Parallels among pathways
There are a number of cases where distantly related proteins are seen at more than one step in different pathways. One of the best known cases is the ubiquitin system and related modifications of proteins such as the SUMO and NEDD8 systems. Note also the similarities to the ubiquitin pathway in autophagy and the related MOCS3 protein in molybdenum cofactor synthesis (see also Ubiquitin and Related Protein Modifications).Pseudogenes
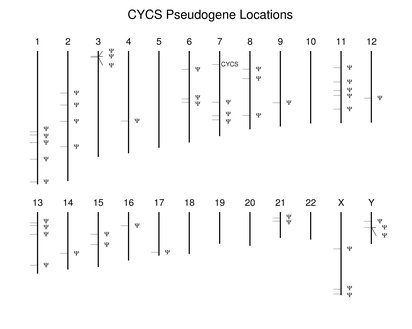
Many nonfunctional copies of human genes are present in the genome. They vary in their differences with their functional relatives with regard to transcription, presence of introns, and other types of mutatons. They are not discussed extensively in the Guide. It is important to note that many predicted proteins in the reference set may prove to be the products of pseudogenes.Many gene families described in the Guide also have pseudogenes in varying numbers. Pseudogenes also are are found where there is a single functional copy. An extreme case involves CYCS (cytochrome c). The following figure shows the locations of the numerous dispersed pseudogenes. Unlike human, mouse has a second functional cytochrome c gene. It is found at a location corresponding to one of the human pseudogenes on chromosome 2.
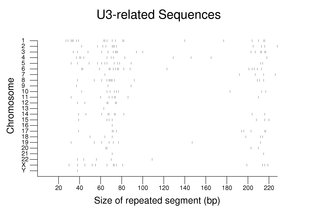
Families for non-protein-coding RNAs can be quite large with a high fraction of psueodogenes. As seen with the CYCS family above, the family members are dispersed among the chromosomes. The following figure shows the sizes and chromosome assignments for sequences related to the U3 RNA involved in ribosomal RNA processing. Although many of these sequences are close to the size of the full-length U3 RNA, note the large fraction of fragments less than 100 bp in size. For additional examples, see Small RNAs in RNA Processing.
Notes and references
Many references and other information for individual genes can be found in the RefSeq entries linked via the pages for the proteins mentioned in this section. A table of these entries (with the corresponding gene identifiers) and a collection of their sequences also are available.Gene sizes and locations used in the figures were from the NCBI Map Viewer coordinates.
For the figure on U3-related sequences, all repeats with names beginning with U3 mapped onto the reference genome sequence were gathered. A total of 230 segments are shown in the figure with 69 being 100 bp or greater in length.
For the second mouse cytochrome c gene, see GI:6753560.
The table on the rearranging loci of the immune system is adapted from the author's A Short Guide to the Human Genome, published in 2008 by Cold Spring Harbor Laboratory Press. It is based on release 36.2 of the reference human genome sequence rather than release 37.1 used in most of this work.
See also the additional reading for this chapter.
Guide to the Human Genome
Copyright © 2010 by Stewart Scherer. All rights reserved.
