
| Name: PASD1 | Sequence: fasta or formatted (773aa) | NCBI GI: 157785548 | |
|
Description: PAS domain containing 1
|
Referenced in:
| ||
|
Composition:
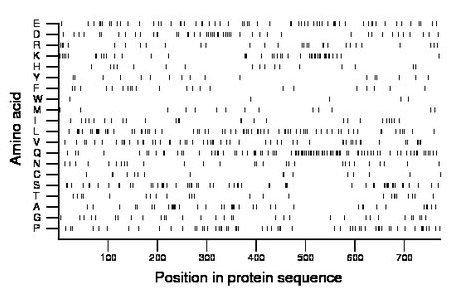
Amino acid Percentage Count Longest homopolymer A alanine 5.4 42 8 C cysteine 2.1 16 2 D aspartate 6.2 48 2 E glutamate 8.3 64 3 F phenylalanine 2.8 22 1 G glycine 4.1 32 1 H histidine 2.2 17 1 I isoleucine 3.6 28 2 K lysine 6.1 47 4 L leucine 9.4 73 2 M methionine 2.1 16 2 N asparagine 3.6 28 1 P proline 7.2 56 2 Q glutamine 12.2 94 3 R arginine 3.8 29 2 S serine 7.5 58 4 T threonine 3.1 24 1 V valine 7.4 57 2 W tryptophan 0.6 5 1 Y tyrosine 2.2 17 1 |
Comparative genomics:
Search single species RefSeq proteins at NCBI
Search summary 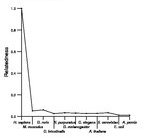
Figure data | ||
Related human proteins:Protein Relative score Description Self-match 1.000 PAS domain containing 1 CLOCK 0.050 clock NPAS2 0.050 neuronal PAS domain protein 2 LOC651807 0.033 PREDICTED: hypothetical protein ZNF853 0.033 zinc finger protein 853 LOC100133758 0.031 PREDICTED: hypothetical protein, partial LOC283685 0.031 PREDICTED: golgi autoantigen, golgin subfamily a-li... FOXP2 0.031 forkhead box P2 isoform I FOXP2 0.029 forkhead box P2 isoform II LOC283685 0.029 PREDICTED: golgi autoantigen, golgin subfamily a-li... MLL2 0.029 myeloid/lymphoid or mixed-lineage leukemia 2 TCHH 0.028 trichohyalin FOXP2 0.027 forkhead box P2 isoform III LOC440243 0.027 PREDICTED: Putative golgin subfamily A member 6-lik... LOC727832 0.027 golgi autoantigen, golgin subfamily a-like LOC645202 0.027 PREDICTED: hypothetical protein LOC645202 LOC283767 0.026 golgi autoantigen, golgin subfamily a-like PAXIP1 0.025 PAX interacting protein 1 TNIK 0.025 TRAF2 and NCK interacting kinase isoform 4 TNIK 0.025 TRAF2 and NCK interacting kinase isoform 3 MED12 0.024 mediator complex subunit 12 TNIK 0.024 TRAF2 and NCK interacting kinase isoform 8 TNIK 0.024 TRAF2 and NCK interacting kinase isoform 7 LOC400352 0.024 PREDICTED: similar to Putative golgin subfamily A m... LOC100132816 0.024 PREDICTED: similar to Putative golgin subfamily A m... MAML2 0.022 mastermind-like 2 MAP4K4 0.022 mitogen-activated protein kinase kinase kinase kinas... CHAF1A 0.022 chromatin assembly factor 1, subunit A (p150) TNIK 0.022 TRAF2 and NCK interacting kinase isoform 2 TNIK 0.022 TRAF2 and NCK interacting kinase isoform 1Human BLASTP results (used to prepare the table) | |||
Gene descriptions are from NCBI RefSeq. Search results were obtained with NCBI BLAST and RefSeq entries. When identical proteins are present, the self-match may not be listed first in BLASTP output. In such cases, the table above has been reordered to place it first.
See About the Figures for the scoring system used in the figure above right. The same scoring system was used in the table of BLASTP results.
Guide to the Human Genome
Copyright © 2010 by Stewart Scherer. All rights reserved.
