
| Name: DAB2 | Sequence: fasta or formatted (770aa) | NCBI GI: 148491082 | |
|
Description: disabled homolog 2
|
Referenced in: Additional Brain Proteins
| ||
|
Composition:
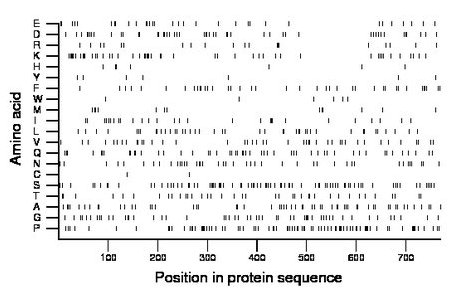
Amino acid Percentage Count Longest homopolymer A alanine 7.5 58 3 C cysteine 0.3 2 1 D aspartate 6.4 49 2 E glutamate 4.4 34 3 F phenylalanine 5.2 40 2 G glycine 7.0 54 2 H histidine 0.9 7 1 I isoleucine 3.8 29 2 K lysine 6.6 51 3 L leucine 5.8 45 2 M methionine 1.8 14 2 N asparagine 5.5 42 1 P proline 11.6 89 3 Q glutamine 6.6 51 2 R arginine 2.6 20 2 S serine 11.7 90 5 T threonine 5.1 39 2 V valine 5.6 43 2 W tryptophan 0.8 6 1 Y tyrosine 0.9 7 1 |
Comparative genomics:
Search single species RefSeq proteins at NCBI
Search summary 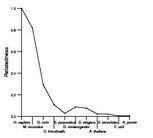
Figure data | ||
Related human proteins:Protein Relative score Description Self-match 1.000 disabled homolog 2 DAB1 0.135 disabled homolog 1 GULP1 0.035 GULP, engulfment adaptor PTB domain containing 1 [Hom... FLJ22184 0.024 PREDICTED: hypothetical protein FLJ22184 SNAP91 0.024 synaptosomal-associated protein, 91kDa homolog FLJ22184 0.023 PREDICTED: hypothetical protein FLJ22184 FLJ22184 0.022 PREDICTED: hypothetical protein LOC80164 LDLRAP1 0.020 low density lipoprotein receptor adaptor protein 1 ... NACA 0.019 nascent polypeptide-associated complex alpha subuni... PCLO 0.018 piccolo isoform 2 PCLO 0.018 piccolo isoform 1 RERE 0.018 atrophin-1 like protein isoform b RERE 0.018 atrophin-1 like protein isoform a RERE 0.018 atrophin-1 like protein isoform a MUC2 0.018 mucin 2 precursor POM121 0.018 nuclear pore membrane protein 121 POM121C 0.018 POM121 membrane glycoprotein (rat)-like NUMB 0.017 numb homolog isoform 4 LOC100133756 0.016 PREDICTED: hypothetical protein, partial NUMB 0.016 numb homolog isoform 3 GLTSCR1 0.016 glioma tumor suppressor candidate region gene 1 [Ho... TAF4 0.016 TBP-associated factor 4 NUMBL 0.016 numb homolog (Drosophila)-like BCORL1 0.016 BCL6 co-repressor-like 1 SF3A2 0.016 splicing factor 3a, subunit 2 MLL2 0.016 myeloid/lymphoid or mixed-lineage leukemia 2 ZNF828 0.016 zinc finger protein 828 WIPF3 0.016 WAS/WASL interacting protein family, member 3 [Homo... ANKS1B 0.016 cajalin 2 isoform b ANKS1B 0.016 cajalin 2 isoform aHuman BLASTP results (used to prepare the table) | |||
Gene descriptions are from NCBI RefSeq. Search results were obtained with NCBI BLAST and RefSeq entries. When identical proteins are present, the self-match may not be listed first in BLASTP output. In such cases, the table above has been reordered to place it first.
See About the Figures for the scoring system used in the figure above right. The same scoring system was used in the table of BLASTP results.
Guide to the Human Genome
Copyright © 2010 by Stewart Scherer. All rights reserved.
