
| Name: HS1BP3 | Sequence: fasta or formatted (392aa) | NCBI GI: 68800430 | |
|
Description: HCLS1 binding protein 3
|
Referenced in: Non-Receptor Tyrosine Kinase Pathways
| ||
|
Composition:
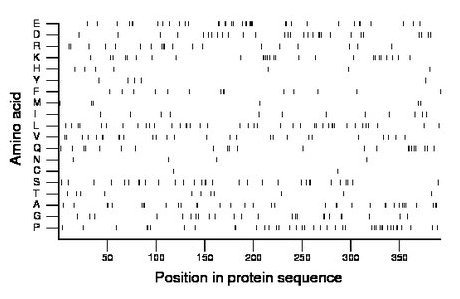
Amino acid Percentage Count Longest homopolymer A alanine 8.9 35 3 C cysteine 0.5 2 1 D aspartate 7.4 29 2 E glutamate 9.4 37 4 F phenylalanine 3.6 14 2 G glycine 6.1 24 2 H histidine 1.8 7 1 I isoleucine 3.1 12 1 K lysine 6.9 27 2 L leucine 10.2 40 3 M methionine 1.5 6 2 N asparagine 1.0 4 1 P proline 10.2 40 2 Q glutamine 5.6 22 2 R arginine 4.8 19 2 S serine 7.9 31 2 T threonine 2.8 11 1 V valine 6.9 27 2 W tryptophan 0.0 0 0 Y tyrosine 1.3 5 1 |
Comparative genomics:
Search single species RefSeq proteins at NCBI
Search summary 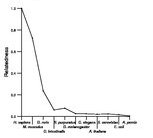
Figure data | ||
Related human proteins:Protein Relative score Description Self-match 1.000 HCLS1 binding protein 3 SNX1 0.040 sorting nexin 1 isoform b SNX1 0.037 sorting nexin 1 isoform c SNX1 0.037 sorting nexin 1 isoform a SNX2 0.031 sorting nexin 2 SETD1B 0.027 SET domain containing 1B TTN 0.020 titin isoform N2-A SGK3 0.020 serum/glucocorticoid regulated kinase 3 isoform 2 [H... SGK3 0.020 serum/glucocorticoid regulated kinase 3 isoform 1 [H... SGK3 0.020 serum/glucocorticoid regulated kinase 3 isoform 1 [H... C2orf55 0.020 hypothetical protein LOC343990 SYNJ1 0.019 synaptojanin 1 isoform d FAM134A 0.019 hypothetical protein LOC79137 HTT 0.019 huntingtin CTDP1 0.019 CTD (carboxy-terminal domain, RNA polymerase II, pol... SH2D2A 0.017 SH2 domain protein 2A isoform 4 SH2D2A 0.017 SH2 domain protein 2A isoform 3 SH2D2A 0.017 SH2 domain protein 2A isoform 1 SH2D2A 0.017 SH2 domain protein 2A isoform 2 SH2D2A 0.017 SH2 domain protein 2A isoform 2 SNX15 0.017 sorting nexin 15 isoform B SNX15 0.017 sorting nexin 15 isoform A LRRC16A 0.016 leucine rich repeat containing 16A MAP7D1 0.016 MAP7 domain containing 1 TNK2 0.016 tyrosine kinase, non-receptor, 2 isoform 1 TNK2 0.016 tyrosine kinase, non-receptor, 2 isoform 2 PRR12 0.016 proline rich 12 SYNJ1 0.015 synaptojanin 1 isoform c SYNJ1 0.015 synaptojanin 1 isoform a SYNJ1 0.015 synaptojanin 1 isoform bHuman BLASTP results (used to prepare the table) | |||
Gene descriptions are from NCBI RefSeq. Search results were obtained with NCBI BLAST and RefSeq entries. When identical proteins are present, the self-match may not be listed first in BLASTP output. In such cases, the table above has been reordered to place it first.
See About the Figures for the scoring system used in the figure above right. The same scoring system was used in the table of BLASTP results.
Guide to the Human Genome
Copyright © 2010 by Stewart Scherer. All rights reserved.
