
| Name: WT1 | Sequence: fasta or formatted (517aa) | NCBI GI: 65508004 | |
|
Description: Wilms tumor 1 isoform D
|
Referenced in: BCL2 Pathways, Caspases, and Programmed Cell Death
| ||
Other entries for this name:
alt prot [497aa] Wilms tumor 1 isoform A alt prot [514aa] Wilms tumor 1 isoform B alt prot [500aa] Wilms tumor 1 isoform C | |||
|
Composition:
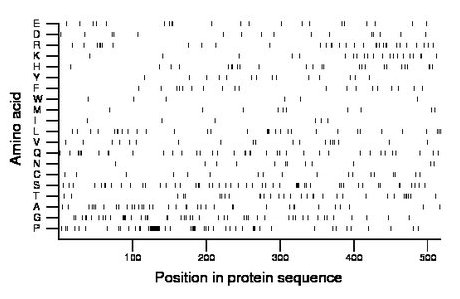
Amino acid Percentage Count Longest homopolymer A alanine 7.5 39 2 C cysteine 3.5 18 1 D aspartate 3.1 16 1 E glutamate 4.1 21 2 F phenylalanine 3.7 19 1 G glycine 9.5 49 5 H histidine 4.8 25 2 I isoleucine 1.2 6 1 K lysine 4.1 21 2 L leucine 6.2 32 3 M methionine 2.1 11 1 N asparagine 2.3 12 1 P proline 10.6 55 9 Q glutamine 7.4 38 2 R arginine 6.2 32 2 S serine 10.1 52 4 T threonine 6.2 32 2 V valine 3.7 19 1 W tryptophan 1.2 6 1 Y tyrosine 2.7 14 1 |
Comparative genomics:
Search single species RefSeq proteins at NCBI
Search summary 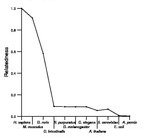
Figure data | ||
Related human proteins:Protein Relative score Description Self-match 1.000 Wilms tumor 1 isoform D WT1 0.991 Wilms tumor 1 isoform B WT1 0.960 Wilms tumor 1 isoform C WT1 0.950 Wilms tumor 1 isoform A KLF10 0.095 Kruppel-like factor 10 isoform b KLF10 0.095 Kruppel-like factor 10 isoform a KLF3 0.092 Kruppel-like factor 3 (basic) EGR1 0.091 early growth response 1 KLF5 0.091 Kruppel-like factor 5 ZNF582 0.090 zinc finger protein 582 KLF11 0.088 Kruppel-like factor 11 EGR2 0.087 early growth response 2 protein isoform b EGR2 0.087 early growth response 2 protein isoform a EGR2 0.087 early growth response 2 protein isoform a EGR2 0.087 early growth response 2 protein isoform a KLF12 0.087 Kruppel-like factor 12 KLF14 0.087 Kruppel-like factor 14 EGR3 0.086 early growth response 3 KLF17 0.086 zinc finger protein 393 KLF7 0.085 Kruppel-like factor 7 (ubiquitous) KLF15 0.085 Kruppel-like factor 15 KLF16 0.085 BTE-binding protein 4 KLF6 0.084 Kruppel-like factor 6 isoform A ZNF233 0.083 zinc finger protein 233 ZNF774 0.083 zinc finger protein 774 KLF1 0.083 Kruppel-like factor 1 (erythroid) KLF8 0.083 Kruppel-like factor 8 isoform 1 KLF9 0.083 Kruppel-like factor 9 KLF4 0.083 Kruppel-like factor 4 (gut) ZNF25 0.083 zinc finger protein 25Human BLASTP results (used to prepare the table) | |||
Gene descriptions are from NCBI RefSeq. Search results were obtained with NCBI BLAST and RefSeq entries. When identical proteins are present, the self-match may not be listed first in BLASTP output. In such cases, the table above has been reordered to place it first.
See About the Figures for the scoring system used in the figure above right. The same scoring system was used in the table of BLASTP results.
Guide to the Human Genome
Copyright © 2010 by Stewart Scherer. All rights reserved.
