
| Name: EGR2 | Sequence: fasta or formatted (476aa) | NCBI GI: 209969755 | |
|
Description: early growth response 2 protein isoform a
|
Referenced in: Oligodendrocytes and Myelin
| ||
Other entries for this name:
alt mRNA [476aa] early growth response 2 protein isoform a alt prot [426aa] early growth response 2 protein isoform b alt mRNA [476aa] early growth response 2 protein isoform a | |||
|
Composition:
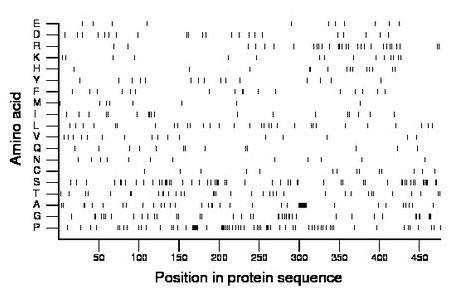
Amino acid Percentage Count Longest homopolymer A alanine 8.6 41 10 C cysteine 2.9 14 1 D aspartate 4.6 22 1 E glutamate 2.3 11 1 F phenylalanine 3.6 17 2 G glycine 8.4 40 3 H histidine 2.9 14 2 I isoleucine 3.8 18 2 K lysine 3.2 15 1 L leucine 6.5 31 1 M methionine 1.9 9 2 N asparagine 2.5 12 1 P proline 14.1 67 7 Q glutamine 2.7 13 1 R arginine 6.1 29 2 S serine 11.8 56 3 T threonine 7.6 36 2 V valine 3.4 16 1 W tryptophan 0.0 0 0 Y tyrosine 3.2 15 1 |
Comparative genomics:
Search single species RefSeq proteins at NCBI
Search summary 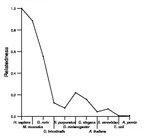
Figure data | ||
Related human proteins:Protein Relative score Description Self-match 1.000 early growth response 2 protein isoform a EGR2 1.000 early growth response 2 protein isoform a EGR2 1.000 early growth response 2 protein isoform a EGR2 0.899 early growth response 2 protein isoform b EGR3 0.330 early growth response 3 EGR1 0.271 early growth response 1 EGR4 0.159 early growth response 4 WT1 0.103 Wilms tumor 1 isoform B WT1 0.103 Wilms tumor 1 isoform A MAZ 0.101 MYC-associated zinc finger protein isoform 2 MAZ 0.101 MYC-associated zinc finger protein isoform 1 WT1 0.097 Wilms tumor 1 isoform D WT1 0.097 Wilms tumor 1 isoform C SP5 0.094 Sp5 transcription factor KLF2 0.088 Kruppel-like factor KLF4 0.085 Kruppel-like factor 4 (gut) KLF14 0.082 Kruppel-like factor 14 ZNF467 0.082 zinc finger protein 467 KLF16 0.080 BTE-binding protein 4 ZNF233 0.079 zinc finger protein 233 ZNF22 0.079 zinc finger protein 22 (KOX 15) ZNF234 0.079 zinc finger protein 234 ZNF234 0.079 zinc finger protein 234 ZNF436 0.079 zinc finger protein 436 ZNF436 0.079 zinc finger protein 436 ZNF286A 0.078 zinc finger protein 286 ZNF286A 0.078 zinc finger protein 286 ZNF429 0.078 zinc finger protein 429 ZNF714 0.078 zinc finger protein 714 KLF11 0.077 Kruppel-like factor 11Human BLASTP results (used to prepare the table) | |||
Gene descriptions are from NCBI RefSeq. Search results were obtained with NCBI BLAST and RefSeq entries. When identical proteins are present, the self-match may not be listed first in BLASTP output. In such cases, the table above has been reordered to place it first.
See About the Figures for the scoring system used in the figure above right. The same scoring system was used in the table of BLASTP results.
Guide to the Human Genome
Copyright © 2010 by Stewart Scherer. All rights reserved.
