
| Name: SRF | Sequence: fasta or formatted (508aa) | NCBI GI: 4507205 | |
|
Description: serum response factor (c-fos serum response element-binding transcription factor)
|
Referenced in: Ets Family
| ||
|
Composition:
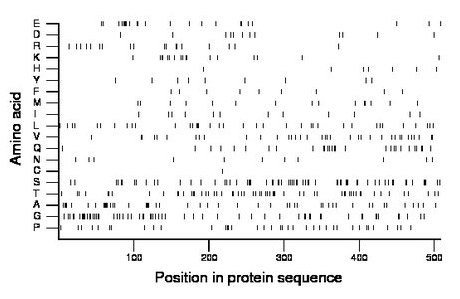
Amino acid Percentage Count Longest homopolymer A alanine 9.8 50 6 C cysteine 0.2 1 1 D aspartate 2.4 12 1 E glutamate 4.5 23 4 F phenylalanine 1.8 9 1 G glycine 12.0 61 5 H histidine 1.4 7 1 I isoleucine 2.4 12 1 K lysine 3.3 17 2 L leucine 7.3 37 3 M methionine 3.1 16 2 N asparagine 2.2 11 1 P proline 7.3 37 2 Q glutamine 5.5 28 2 R arginine 3.7 19 2 S serine 12.6 64 3 T threonine 11.6 59 2 V valine 7.1 36 2 W tryptophan 0.0 0 0 Y tyrosine 1.8 9 1 |
Comparative genomics:
Search single species RefSeq proteins at NCBI
Search summary 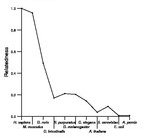
Figure data | ||
Related human proteins:Protein Relative score Description Self-match 1.000 serum response factor (c-fos serum response element-b... MEF2A 0.046 myocyte enhancer factor 2A isoform 2 MEF2A 0.040 myocyte enhancer factor 2A isoform 1 MEF2C 0.036 myocyte enhancer factor 2C isoform 1 MEF2D 0.035 myocyte enhancer factor 2D MEF2C 0.035 myocyte enhancer factor 2C isoform 2 LOC100131514 0.034 PREDICTED: similar to hCG1747327, partial MUC17 0.033 mucin 17 LOC100294249 0.031 PREDICTED: hypothetical protein XP_002344067 LOC100294420 0.030 PREDICTED: similar to mucin 2 MUC4 0.030 mucin 4 isoform a MUC16 0.030 mucin 16 LOC729792 0.030 PREDICTED: hypothetical protein LOC729792 0.030 PREDICTED: hypothetical protein MUC12 0.030 PREDICTED: mucin 12 LOC729792 0.030 PREDICTED: hypothetical protein LOC100294501 0.030 PREDICTED: hypothetical protein LOC100294238 0.030 PREDICTED: hypothetical protein LOC100294204 0.030 PREDICTED: hypothetical protein LOC100294136 0.030 PREDICTED: hypothetical protein LOC100294091 0.030 PREDICTED: hypothetical protein LOC730401 0.030 PREDICTED: hypothetical protein MUC2 0.028 mucin 2 precursor MUC6 0.028 mucin 6, gastric LOC729991-MEF2B 0.028 myocyte enhancer factor 2B isoform b MEF2B 0.027 myocyte enhancer factor 2B isoform a MUC3A 0.026 PREDICTED: mucin 3A, cell surface associated, parti... MUC5B 0.026 mucin 5, subtype B, tracheobronchial MUC5AC 0.025 mucin 5AC HOXD9 0.023 homeobox D9Human BLASTP results (used to prepare the table) | |||
Gene descriptions are from NCBI RefSeq. Search results were obtained with NCBI BLAST and RefSeq entries. When identical proteins are present, the self-match may not be listed first in BLASTP output. In such cases, the table above has been reordered to place it first.
See About the Figures for the scoring system used in the figure above right. The same scoring system was used in the table of BLASTP results.
Guide to the Human Genome
Copyright © 2010 by Stewart Scherer. All rights reserved.
