
| Name: EPPK1 | Sequence: fasta or formatted (5090aa) | NCBI GI: 207452735 | |
|
Description: epiplakin 1
|
Referenced in: Protein Composition and Structure
| ||
|
Composition:
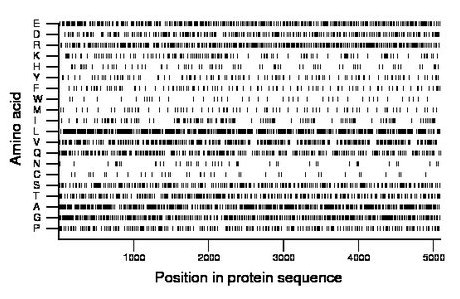
Amino acid Percentage Count Longest homopolymer A alanine 10.9 557 8 C cysteine 0.8 42 1 D aspartate 5.0 252 2 E glutamate 8.3 424 2 F phenylalanine 2.1 109 3 G glycine 8.6 438 2 H histidine 1.6 82 3 I isoleucine 2.9 149 2 K lysine 2.6 130 2 L leucine 12.4 629 4 M methionine 1.5 75 1 N asparagine 1.0 51 2 P proline 4.9 248 2 Q glutamine 6.5 331 2 R arginine 8.5 433 3 S serine 5.6 287 4 T threonine 6.0 303 3 V valine 7.7 393 2 W tryptophan 0.8 42 1 Y tyrosine 2.3 115 1 |
Comparative genomics:
Search single species RefSeq proteins at NCBI
Search summary 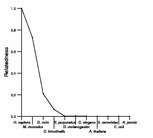
Figure data | ||
Related human proteins:Protein Relative score Description Self-match 1.000 epiplakin 1 PLEC1 0.126 plectin 1 isoform 11 PLEC1 0.126 plectin 1 isoform 10 PLEC1 0.126 plectin 1 isoform 8 PLEC1 0.126 plectin 1 isoform 7 PLEC1 0.126 plectin 1 isoform 6 PLEC1 0.126 plectin 1 isoform 3 PLEC1 0.126 plectin 1 isoform 2 PLEC1 0.126 plectin 1 isoform 1 DSP 0.036 desmoplakin isoform II DSP 0.036 desmoplakin isoform I DST 0.024 dystonin isoform 1e precursor MACF1 0.010 microfilament and actin filament cross-linker protei... EVPL 0.010 envoplakin DST 0.007 dystonin isoform 1eB precursor LOC100129654 0.002 PREDICTED: similar to transcription factor 23 [Homo... LOC100129654 0.002 PREDICTED: similar to transcription factor 23 [Homo... LOC100129654 0.002 PREDICTED: similar to transcription factor 23 [Homo... LOC100292082 0.002 PREDICTED: hypothetical protein XP_002345881 LOC100290709 0.001 PREDICTED: hypothetical protein XP_002346752 TRIM56 0.001 tripartite motif-containing 56 MYH10 0.001 myosin, heavy polypeptide 10, non-muscle KIAA1755 0.001 hypothetical protein LOC85449 RPGR 0.001 retinitis pigmentosa GTPase regulator isoform C [Hom... TCOF1 0.001 Treacher Collins-Franceschetti syndrome 1 isoform c ... ODF2L 0.001 outer dense fiber of sperm tails 2-like isoform b [H... ODF2L 0.001 outer dense fiber of sperm tails 2-like isoform a [H... PALM3 0.001 hypothetical protein LOC342979 LOC100128598 0.001 PREDICTED: hypothetical protein LOC100128598 0.001 PREDICTED: hypothetical proteinHuman BLASTP results (used to prepare the table) | |||
Gene descriptions are from NCBI RefSeq. Search results were obtained with NCBI BLAST and RefSeq entries. When identical proteins are present, the self-match may not be listed first in BLASTP output. In such cases, the table above has been reordered to place it first.
See About the Figures for the scoring system used in the figure above right. The same scoring system was used in the table of BLASTP results.
Guide to the Human Genome
Copyright © 2010 by Stewart Scherer. All rights reserved.
