
| Name: IQGAP3 | Sequence: fasta or formatted (1631aa) | NCBI GI: 39753961 | |
|
Description: IQ motif containing GTPase activating protein 3
|
Referenced in: Additional Interaction Domain Families
| ||
|
Composition:
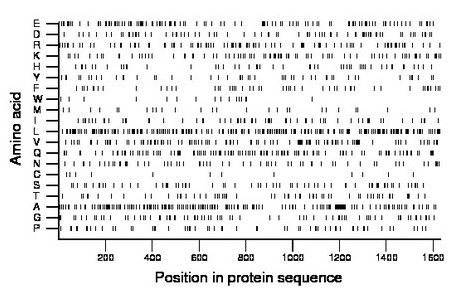
Amino acid Percentage Count Longest homopolymer A alanine 11.0 179 3 C cysteine 0.7 12 1 D aspartate 4.9 80 2 E glutamate 7.4 120 2 F phenylalanine 3.2 52 2 G glycine 4.5 73 2 H histidine 3.1 50 1 I isoleucine 3.9 63 2 K lysine 5.8 94 2 L leucine 13.1 214 3 M methionine 1.8 29 2 N asparagine 3.7 61 1 P proline 3.8 62 2 Q glutamine 7.2 118 4 R arginine 6.4 104 2 S serine 4.4 72 2 T threonine 3.9 63 2 V valine 7.2 117 2 W tryptophan 1.0 16 1 Y tyrosine 3.2 52 2 |
Comparative genomics:
Search single species RefSeq proteins at NCBI
Search summary 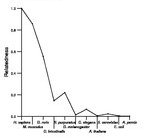
Figure data | ||
Related human proteins:Protein Relative score Description Self-match 1.000 IQ motif containing GTPase activating protein 3 [Hom... IQGAP1 0.596 IQ motif containing GTPase activating protein 1 [Homo... IQGAP2 0.380 IQ motif containing GTPase activating protein 2 [Ho... NF1 0.014 neurofibromin isoform 2 NF1 0.011 neurofibromin isoform 1 ASPM 0.009 asp (abnormal spindle)-like, microcephaly associate... GAPVD1 0.008 GTPase activating protein and VPS9 domains 1 MYO5C 0.007 myosin VC RASAL1 0.007 RAS protein activator like 1 RASA1 0.006 RAS p21 protein activator 1 isoform 1 RASA1 0.006 RAS p21 protein activator 1 isoform 2 IQCF5 0.005 IQ motif containing F5 RASA3 0.005 RAS p21 protein activator 3 DAB2IP 0.005 disabled homolog 2 interacting protein isoform 2 [Ho... DAB2IP 0.005 disabled homolog 2 interacting protein isoform 1 [Ho... RASAL2 0.004 RAS protein activator like 2 isoform 1 MYO5A 0.004 myosin VA isoform 2 MYO5A 0.004 myosin VA isoform 1 VAV1 0.004 vav 1 guanine nucleotide exchange factor TAGLN2 0.004 transgelin 2 MYO7B 0.004 myosin VIIB RASAL2 0.004 RAS protein activator like 2 isoform 2 TACC3 0.004 transforming, acidic coiled-coil containing protein 3... KIAA1683 0.004 KIAA1683 isoform a EEA1 0.004 early endosome antigen 1, 162kD KIAA1683 0.004 KIAA1683 isoform c KIAA1683 0.004 KIAA1683 isoform b SDCCAG8 0.004 serologically defined colon cancer antigen 8 MYO9A 0.004 myosin IXA MYO7A 0.004 myosin VIIA isoform 2Human BLASTP results (used to prepare the table) | |||
Gene descriptions are from NCBI RefSeq. Search results were obtained with NCBI BLAST and RefSeq entries. When identical proteins are present, the self-match may not be listed first in BLASTP output. In such cases, the table above has been reordered to place it first.
See About the Figures for the scoring system used in the figure above right. The same scoring system was used in the table of BLASTP results.
Guide to the Human Genome
Copyright © 2010 by Stewart Scherer. All rights reserved.
