
| Name: SDCCAG8 | Sequence: fasta or formatted (713aa) | NCBI GI: 28269672 | |
|
Description: serologically defined colon cancer antigen 8
|
Referenced in: Centrosome
| ||
|
Composition:
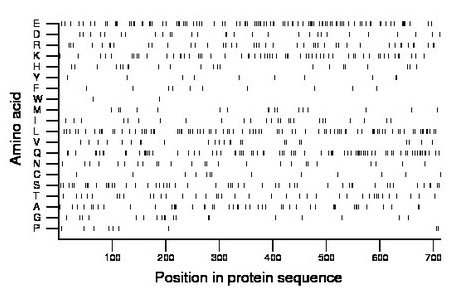
Amino acid Percentage Count Longest homopolymer A alanine 6.5 46 2 C cysteine 2.0 14 2 D aspartate 4.1 29 2 E glutamate 13.7 98 2 F phenylalanine 1.4 10 1 G glycine 2.7 19 2 H histidine 3.1 22 2 I isoleucine 3.5 25 1 K lysine 8.4 60 2 L leucine 12.1 86 3 M methionine 2.5 18 2 N asparagine 3.5 25 1 P proline 1.3 9 1 Q glutamine 11.1 79 3 R arginine 6.2 44 3 S serine 7.3 52 2 T threonine 5.5 39 2 V valine 3.6 26 3 W tryptophan 0.3 2 1 Y tyrosine 1.4 10 1 |
Comparative genomics:
Search single species RefSeq proteins at NCBI
Search summary 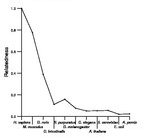
Figure data | ||
Related human proteins:Protein Relative score Description Self-match 1.000 serologically defined colon cancer antigen 8 SCLT1 0.060 sodium channel associated protein 1 EEA1 0.057 early endosome antigen 1, 162kD GOLGA4 0.054 golgi autoantigen, golgin subfamily a, 4 MYH10 0.053 myosin, heavy polypeptide 10, non-muscle MYH13 0.053 myosin, heavy polypeptide 13, skeletal muscle [Homo... PLEC1 0.053 plectin 1 isoform 11 PLEC1 0.053 plectin 1 isoform 10 PLEC1 0.053 plectin 1 isoform 8 PLEC1 0.053 plectin 1 isoform 7 PLEC1 0.053 plectin 1 isoform 6 PLEC1 0.053 plectin 1 isoform 3 PLEC1 0.053 plectin 1 isoform 2 PLEC1 0.053 plectin 1 isoform 1 CIT 0.052 citron TCHH 0.051 trichohyalin MYH7 0.051 myosin, heavy chain 7, cardiac muscle, beta GOLGB1 0.051 golgi autoantigen, golgin subfamily b, macrogolgin ... LOC283767 0.049 golgi autoantigen, golgin subfamily a-like ROCK1 0.049 Rho-associated, coiled-coil containing protein kinase... CGNL1 0.049 cingulin-like 1 CCDC88A 0.049 coiled-coil domain containing 88A isoform 1 MYH1 0.049 myosin, heavy chain 1, skeletal muscle, adult [Homo... MYH9 0.049 myosin, heavy polypeptide 9, non-muscle LOC440243 0.049 PREDICTED: Putative golgin subfamily A member 6-lik... CEP250 0.049 centrosomal protein 2 LOC727832 0.049 golgi autoantigen, golgin subfamily a-like CCDC88A 0.049 coiled-coil domain containing 88A isoform 2 CCDC18 0.049 sarcoma antigen NY-SAR-41 CLIP1 0.049 restin isoform bHuman BLASTP results (used to prepare the table) | |||
Gene descriptions are from NCBI RefSeq. Search results were obtained with NCBI BLAST and RefSeq entries. When identical proteins are present, the self-match may not be listed first in BLASTP output. In such cases, the table above has been reordered to place it first.
See About the Figures for the scoring system used in the figure above right. The same scoring system was used in the table of BLASTP results.
Guide to the Human Genome
Copyright © 2010 by Stewart Scherer. All rights reserved.
