
| Name: RASIP1 | Sequence: fasta or formatted (963aa) | NCBI GI: 38570105 | |
|
Description: Ras-interacting protein 1
|
Referenced in:
| ||
|
Composition:
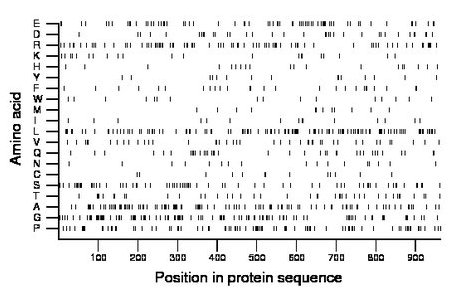
Amino acid Percentage Count Longest homopolymer A alanine 10.8 104 4 C cysteine 1.3 13 1 D aspartate 3.6 35 2 E glutamate 7.1 68 3 F phenylalanine 2.9 28 3 G glycine 10.9 105 3 H histidine 2.1 20 2 I isoleucine 1.6 15 1 K lysine 2.3 22 2 L leucine 13.0 125 3 M methionine 1.3 13 1 N asparagine 1.8 17 1 P proline 9.2 89 5 Q glutamine 3.9 38 2 R arginine 8.7 84 4 S serine 7.5 72 4 T threonine 4.3 41 2 V valine 4.5 43 2 W tryptophan 1.7 16 1 Y tyrosine 1.6 15 2 |
Comparative genomics:
Search single species RefSeq proteins at NCBI
Search summary 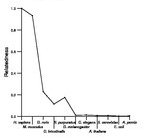
Figure data | ||
Related human proteins:Protein Relative score Description Self-match 1.000 Ras-interacting protein 1 RADIL 0.237 Rap GTPase interactor MYO5C 0.017 myosin VC MLLT4 0.014 myeloid/lymphoid or mixed-lineage leukemia (trithora... MLLT4 0.014 myeloid/lymphoid or mixed-lineage leukemia (trithora... MLLT4 0.014 myeloid/lymphoid or mixed-lineage leukemia (trithora... COL2A1 0.013 collagen, type II, alpha 1 isoform 1 precursor [Hom... COL2A1 0.013 collagen, type II, alpha 1 isoform 2 precursor [Hom... ZBTB4 0.011 zinc finger and BTB domain containing 4 ZBTB4 0.011 zinc finger and BTB domain containing 4 DACT3 0.010 thymus expressed gene 3-like GATA4 0.010 GATA binding protein 4 MYO5A 0.010 myosin VA isoform 2 MYO5A 0.010 myosin VA isoform 1 MYO5B 0.010 myosin VB ARID1A 0.010 AT rich interactive domain 1A isoform a ARID1A 0.010 AT rich interactive domain 1A isoform b CLASP1 0.009 CLIP-associating protein 1 isoform 1 CECR6 0.009 cat eye syndrome chromosome region, candidate 6 isof... LOC100134283 0.009 PREDICTED: hypothetical protein GATA6 0.009 GATA binding protein 6 LBXCOR1 0.009 LBXCOR1 homolog LOC100292082 0.008 PREDICTED: hypothetical protein XP_002345881 LOC100292339 0.008 PREDICTED: hypothetical protein LOC100288937 0.008 PREDICTED: hypothetical protein XP_002343343 PRR12 0.008 proline rich 12 LOC100292370 0.007 PREDICTED: hypothetical protein TRIM28 0.007 tripartite motif-containing 28 protein RBM15B 0.007 RNA binding motif protein 15B ZNF703 0.007 zinc finger protein 703Human BLASTP results (used to prepare the table) | |||
Gene descriptions are from NCBI RefSeq. Search results were obtained with NCBI BLAST and RefSeq entries. When identical proteins are present, the self-match may not be listed first in BLASTP output. In such cases, the table above has been reordered to place it first.
See About the Figures for the scoring system used in the figure above right. The same scoring system was used in the table of BLASTP results.
Guide to the Human Genome
Copyright © 2010 by Stewart Scherer. All rights reserved.
