
| Name: MYO5B | Sequence: fasta or formatted (1848aa) | NCBI GI: 122937345 | |
|
Description: myosin VB
|
Referenced in:
| ||
|
Composition:
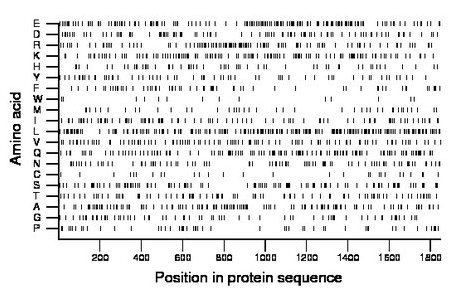
Amino acid Percentage Count Longest homopolymer A alanine 6.8 126 3 C cysteine 1.5 28 1 D aspartate 5.2 96 2 E glutamate 8.7 161 3 F phenylalanine 3.4 63 2 G glycine 3.7 68 2 H histidine 3.0 55 1 I isoleucine 5.3 98 2 K lysine 7.2 133 3 L leucine 11.0 204 3 M methionine 2.3 43 1 N asparagine 4.7 86 2 P proline 2.8 52 2 Q glutamine 7.4 136 3 R arginine 6.3 116 2 S serine 6.2 115 3 T threonine 4.8 89 2 V valine 5.5 102 2 W tryptophan 0.8 14 1 Y tyrosine 3.4 63 1 |
Comparative genomics:
Search single species RefSeq proteins at NCBI
Search summary 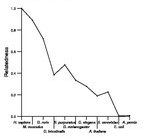
Figure data | ||
Related human proteins:Protein Relative score Description Self-match 1.000 myosin VB MYO5A 0.624 myosin VA isoform 1 MYO5A 0.617 myosin VA isoform 2 MYO5C 0.446 myosin VC MYH11 0.157 smooth muscle myosin heavy chain 11 isoform SM1A [Ho... MYH11 0.157 smooth muscle myosin heavy chain 11 isoform SM2A [Ho... MYH11 0.156 smooth muscle myosin heavy chain 11 isoform SM1B [Ho... MYH11 0.156 smooth muscle myosin heavy chain 11 isoform SM2B [Ho... MYH10 0.155 myosin, heavy polypeptide 10, non-muscle MYH9 0.154 myosin, heavy polypeptide 9, non-muscle MYH3 0.153 myosin, heavy chain 3, skeletal muscle, embryonic [H... MYH6 0.153 myosin heavy chain 6 MYH13 0.153 myosin, heavy polypeptide 13, skeletal muscle [Homo... MYH7 0.153 myosin, heavy chain 7, cardiac muscle, beta MYH7B 0.152 myosin, heavy polypeptide 7B, cardiac muscle, beta ... MYH8 0.151 myosin, heavy chain 8, skeletal muscle, perinatal [... MYH1 0.150 myosin, heavy chain 1, skeletal muscle, adult [Homo... MYH4 0.150 myosin, heavy polypeptide 4, skeletal muscle MYO7A 0.149 myosin VIIA isoform 2 MYO7A 0.149 myosin VIIA isoform 3 MYO7A 0.149 myosin VIIA isoform 1 MYH2 0.148 myosin, heavy chain 2, skeletal muscle, adult [Homo... MYH2 0.148 myosin, heavy chain 2, skeletal muscle, adult [Homo... MYH14 0.147 myosin, heavy chain 14 isoform 2 MYH15 0.147 myosin, heavy polypeptide 15 MYH14 0.146 myosin, heavy chain 14 isoform 1 MYO10 0.146 myosin X MYH14 0.145 myosin, heavy chain 14 isoform 3 MYO7B 0.142 myosin VIIB MYO1B 0.134 myosin IB isoform 1Human BLASTP results (used to prepare the table) | |||
Gene descriptions are from NCBI RefSeq. Search results were obtained with NCBI BLAST and RefSeq entries. When identical proteins are present, the self-match may not be listed first in BLASTP output. In such cases, the table above has been reordered to place it first.
See About the Figures for the scoring system used in the figure above right. The same scoring system was used in the table of BLASTP results.
Guide to the Human Genome
Copyright © 2010 by Stewart Scherer. All rights reserved.
