
| Name: EMB | Sequence: fasta or formatted (327aa) | NCBI GI: 38348215 | |
|
Description: embigin
|
Referenced in:
| ||
|
Composition:
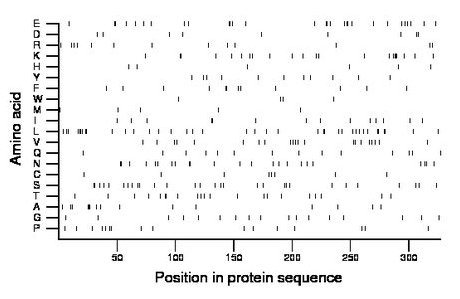
Amino acid Percentage Count Longest homopolymer A alanine 4.6 15 3 C cysteine 2.4 8 1 D aspartate 2.8 9 2 E glutamate 8.9 29 2 F phenylalanine 3.7 12 2 G glycine 5.2 17 1 H histidine 1.8 6 1 I isoleucine 4.3 14 2 K lysine 6.7 22 4 L leucine 11.6 38 4 M methionine 1.5 5 1 N asparagine 7.0 23 2 P proline 4.9 16 2 Q glutamine 4.3 14 1 R arginine 4.0 13 1 S serine 8.9 29 2 T threonine 6.4 21 2 V valine 6.4 21 2 W tryptophan 1.2 4 1 Y tyrosine 3.4 11 1 |
Comparative genomics:
Search single species RefSeq proteins at NCBI
Search summary 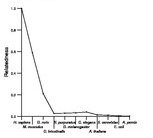
Figure data | ||
Related human proteins:Protein Relative score Description Self-match 1.000 embigin NPTN 0.069 neuroplastin isoform a precursor NPTN 0.069 neuroplastin isoform b precursor BSG 0.066 basigin isoform 1 precursor BSG 0.066 basigin isoform 2 precursor NPTN 0.066 neuroplastin isoform d precursor NPTN 0.066 neuroplastin isoform c precursor BSG 0.058 basigin isoform 4 TTN 0.041 titin isoform N2-A LOC100292387 0.035 PREDICTED: similar to hemicentin 2 HMCN2 0.035 PREDICTED: hemicentin 2 LOC100289200 0.035 PREDICTED: hypothetical protein XP_002342997 CD22 0.027 CD22 molecule DSCAM 0.027 Down syndrome cell adhesion molecule isoform CHD2-42... HMCN2 0.025 PREDICTED: hemicentin 2 HMCN2 0.025 PREDICTED: hemicentin 2 HMCN1 0.025 hemicentin 1 NCAM1 0.022 neural cell adhesion molecule 1 isoform 1 NCAM1 0.022 neural cell adhesion molecule 1 isoform 3 LRIG1 0.022 leucine-rich repeats and immunoglobulin-like domains... NCAM2 0.020 neural cell adhesion molecule 2 precursor OBSCN 0.019 obscurin, cytoskeletal calmodulin and titin-interact... OBSCN 0.019 obscurin, cytoskeletal calmodulin and titin-interac... VCAM1 0.017 vascular cell adhesion molecule 1 isoform a precursor... KIRREL 0.017 kin of IRRE like HSPG2 0.017 heparan sulfate proteoglycan 2 NCAM1 0.017 neural cell adhesion molecule 1 isoform 2 CNTN6 0.017 contactin 6 DSCAML1 0.016 Down syndrome cell adhesion molecule like 1 BTNL2 0.016 butyrophilin-like 2Human BLASTP results (used to prepare the table) | |||
Gene descriptions are from NCBI RefSeq. Search results were obtained with NCBI BLAST and RefSeq entries. When identical proteins are present, the self-match may not be listed first in BLASTP output. In such cases, the table above has been reordered to place it first.
See About the Figures for the scoring system used in the figure above right. The same scoring system was used in the table of BLASTP results.
Guide to the Human Genome
Copyright © 2010 by Stewart Scherer. All rights reserved.
