
| Name: ERC2 | Sequence: fasta or formatted (957aa) | NCBI GI: 34577114 | |
|
Description: cytomatrix protein p110
|
Referenced in:
| ||
|
Composition:
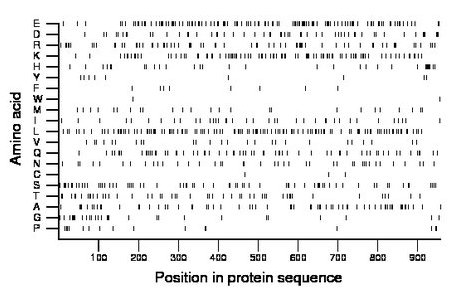
Amino acid Percentage Count Longest homopolymer A alanine 6.8 65 2 C cysteine 0.3 3 1 D aspartate 5.9 56 3 E glutamate 12.4 119 3 F phenylalanine 0.8 8 1 G glycine 3.2 31 5 H histidine 4.2 40 9 I isoleucine 4.1 39 2 K lysine 10.0 96 4 L leucine 12.7 122 2 M methionine 2.7 26 1 N asparagine 4.3 41 1 P proline 1.7 16 1 Q glutamine 6.9 66 2 R arginine 7.2 69 3 S serine 7.5 72 2 T threonine 5.1 49 2 V valine 2.7 26 1 W tryptophan 0.2 2 1 Y tyrosine 1.1 11 2 |
Comparative genomics:
Search single species RefSeq proteins at NCBI
Search summary 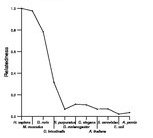
Figure data | ||
Related human proteins:Protein Relative score Description Self-match 1.000 cytomatrix protein p110 ERC1 0.693 RAB6-interacting protein 2 isoform delta ERC1 0.686 RAB6-interacting protein 2 isoform epsilon MYH11 0.065 smooth muscle myosin heavy chain 11 isoform SM1A [Ho... MYH11 0.065 smooth muscle myosin heavy chain 11 isoform SM1B [Ho... MYH11 0.065 smooth muscle myosin heavy chain 11 isoform SM2B [Ho... MYH11 0.065 smooth muscle myosin heavy chain 11 isoform SM2A [Ho... MYH9 0.064 myosin, heavy polypeptide 9, non-muscle CCDC88A 0.064 coiled-coil domain containing 88A isoform 1 CCDC88A 0.063 coiled-coil domain containing 88A isoform 2 GOLGA3 0.061 Golgi autoantigen, golgin subfamily a, 3 CLIP1 0.061 restin isoform a EEA1 0.060 early endosome antigen 1, 162kD CLIP1 0.060 restin isoform b CCDC158 0.060 coiled-coil domain containing 158 CENPE 0.060 centromere protein E MYH6 0.059 myosin heavy chain 6 MYH3 0.058 myosin, heavy chain 3, skeletal muscle, embryonic [H... GOLGA4 0.058 golgi autoantigen, golgin subfamily a, 4 MYH1 0.058 myosin, heavy chain 1, skeletal muscle, adult [Homo... KTN1 0.056 kinectin 1 isoform a KTN1 0.056 kinectin 1 isoform c KTN1 0.056 kinectin 1 isoform a MYH10 0.056 myosin, heavy polypeptide 10, non-muscle MYH13 0.056 myosin, heavy polypeptide 13, skeletal muscle [Homo... CENPF 0.056 centromere protein F KIF20B 0.056 M-phase phosphoprotein 1 GOLGB1 0.055 golgi autoantigen, golgin subfamily b, macrogolgin ... PPL 0.055 periplakin NUMA1 0.054 nuclear mitotic apparatus protein 1Human BLASTP results (used to prepare the table) | |||
Gene descriptions are from NCBI RefSeq. Search results were obtained with NCBI BLAST and RefSeq entries. When identical proteins are present, the self-match may not be listed first in BLASTP output. In such cases, the table above has been reordered to place it first.
See About the Figures for the scoring system used in the figure above right. The same scoring system was used in the table of BLASTP results.
Guide to the Human Genome
Copyright © 2010 by Stewart Scherer. All rights reserved.
