
| Name: GPR119 | Sequence: fasta or formatted (335aa) | NCBI GI: 30425400 | |
|
Description: G protein-coupled receptor 119
|
Referenced in:
| ||
|
Composition:
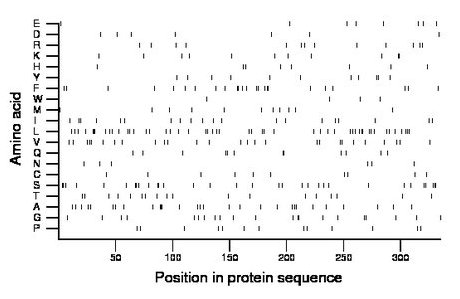
Amino acid Percentage Count Longest homopolymer A alanine 8.7 29 3 C cysteine 3.0 10 1 D aspartate 2.1 7 1 E glutamate 2.4 8 1 F phenylalanine 7.2 24 2 G glycine 6.3 21 2 H histidine 2.4 8 1 I isoleucine 6.0 20 2 K lysine 3.3 11 2 L leucine 14.9 50 3 M methionine 3.3 11 1 N asparagine 1.8 6 1 P proline 3.9 13 1 Q glutamine 3.6 12 2 R arginine 3.9 13 1 S serine 9.6 32 3 T threonine 5.4 18 1 V valine 8.1 27 1 W tryptophan 1.2 4 1 Y tyrosine 3.3 11 1 |
Comparative genomics:
Search single species RefSeq proteins at NCBI
Search summary 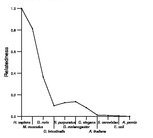
Figure data | ||
Related human proteins:Protein Relative score Description Self-match 1.000 G protein-coupled receptor 119 ADRB2 0.119 adrenergic, beta-2-, receptor, surface HTR4 0.119 serotonin 5-HT4 receptor isoform n HTR4 0.119 serotonin 5-HT4 receptor isoform i HTR4 0.119 serotonin 5-HT4 receptor isoform d HTR4 0.119 serotonin 5-HT4 receptor isoform a HTR4 0.119 serotonin 5-HT4 receptor isoform g HTR4 0.119 serotonin 5-HT4 receptor isoform b HTR6 0.118 5-hydroxytryptamine (serotonin) receptor 6 DRD1 0.114 dopamine receptor D1 HTR4 0.111 serotonin 5-HT4 receptor isoform hb ADORA1 0.110 adenosine A1 receptor ADORA1 0.110 adenosine A1 receptor ADRB1 0.103 beta-1-adrenergic receptor HRH2 0.103 histamine receptor H2 isoform 1 HRH2 0.103 histamine receptor H2 isoform 2 GPR6 0.097 G protein-coupled receptor 6 ADORA2A 0.097 adenosine A2a receptor DRD5 0.096 dopamine receptor D5 HTR2A 0.089 5-hydroxytryptamine (serotonin) receptor 2A TAAR9 0.089 trace amine associated receptor 9 HTR5A 0.088 5-hydroxytryptamine receptor 5A GPR12 0.086 G protein-coupled receptor 12 ADRB3 0.085 adrenergic, beta-3-, receptor MC5R 0.082 melanocortin 5 receptor MC4R 0.082 melanocortin 4 receptor ADORA2B 0.080 adenosine A2b receptor SSTR5 0.078 somatostatin receptor 5 LPAR1 0.078 lysophosphatidic acid receptor 1 LPAR1 0.078 lysophosphatidic acid receptor 1Human BLASTP results (used to prepare the table) | |||
Gene descriptions are from NCBI RefSeq. Search results were obtained with NCBI BLAST and RefSeq entries. When identical proteins are present, the self-match may not be listed first in BLASTP output. In such cases, the table above has been reordered to place it first.
See About the Figures for the scoring system used in the figure above right. The same scoring system was used in the table of BLASTP results.
Guide to the Human Genome
Copyright © 2010 by Stewart Scherer. All rights reserved.
