
| Name: CHL1 | Sequence: fasta or formatted (1224aa) | NCBI GI: 27894376 | |
|
Description: cell adhesion molecule with homology to L1CAM precursor
|
Referenced in:
| ||
|
Composition:
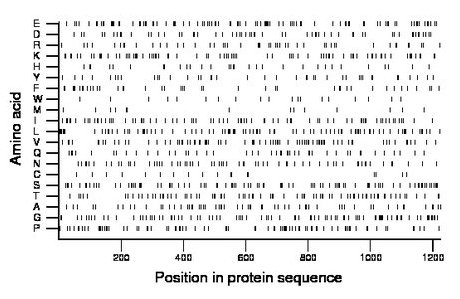
Amino acid Percentage Count Longest homopolymer A alanine 5.1 62 2 C cysteine 1.6 19 2 D aspartate 4.8 59 2 E glutamate 8.3 101 3 F phenylalanine 3.5 43 2 G glycine 7.1 87 2 H histidine 2.6 32 2 I isoleucine 6.2 76 3 K lysine 6.5 79 2 L leucine 7.9 97 4 M methionine 1.2 15 1 N asparagine 5.3 65 2 P proline 6.9 84 2 Q glutamine 3.8 46 2 R arginine 3.9 48 2 S serine 7.6 93 4 T threonine 6.4 78 2 V valine 6.5 80 2 W tryptophan 1.6 20 2 Y tyrosine 3.3 40 1 |
Comparative genomics:
Search single species RefSeq proteins at NCBI
Search summary 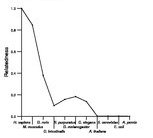
Figure data | ||
Related human proteins:Protein Relative score Description Self-match 1.000 cell adhesion molecule with homology to L1CAM precur... NRCAM 0.344 neuronal cell adhesion molecule isoform A precursor ... NRCAM 0.342 neuronal cell adhesion molecule isoform B precursor ... L1CAM 0.327 L1 cell adhesion molecule isoform 3 precursor [Homo... L1CAM 0.325 L1 cell adhesion molecule isoform 2 precursor NFASC 0.324 neurofascin isoform 3 precursor L1CAM 0.323 L1 cell adhesion molecule isoform 1 precursor NFASC 0.323 neurofascin isoform 4 precursor NFASC 0.320 neurofascin isoform 2 precursor NFASC 0.275 neurofascin isoform 1 precursor NFASC 0.156 neurofascin isoform 6 precursor NFASC 0.153 neurofascin isoform 5 precursor CNTN2 0.149 contactin 2 precursor CNTN3 0.141 contactin 3 CNTN4 0.133 contactin 4 isoform a precursor CNTN6 0.133 contactin 6 CNTN5 0.130 contactin 5 isoform long CNTN5 0.130 contactin 5 isoform short CNTN1 0.128 contactin 1 isoform 1 precursor CNTN1 0.128 contactin 1 isoform 2 precursor SDK1 0.104 sidekick 1 SDK2 0.099 sidekick 2 CNTN4 0.098 contactin 4 isoform c precursor DCC 0.080 deleted in colorectal carcinoma DSCAM 0.076 Down syndrome cell adhesion molecule isoform CHD2-42... DSCAML1 0.075 Down syndrome cell adhesion molecule like 1 NEO1 0.069 neogenin homolog 1 ROBO2 0.069 roundabout, axon guidance receptor, homolog 2 isofor... ROBO2 0.068 roundabout, axon guidance receptor, homolog 2 isofo... ROBO1 0.064 roundabout 1 isoform bHuman BLASTP results (used to prepare the table) | |||
Gene descriptions are from NCBI RefSeq. Search results were obtained with NCBI BLAST and RefSeq entries. When identical proteins are present, the self-match may not be listed first in BLASTP output. In such cases, the table above has been reordered to place it first.
See About the Figures for the scoring system used in the figure above right. The same scoring system was used in the table of BLASTP results.
Guide to the Human Genome
Copyright © 2010 by Stewart Scherer. All rights reserved.
