
| Name: LOC100292259 | Sequence: fasta or formatted (103aa) | NCBI GI: 239753580 | |
|
Description: PREDICTED: hypothetical protein
| Not currently referenced in the text | ||
|
Composition:
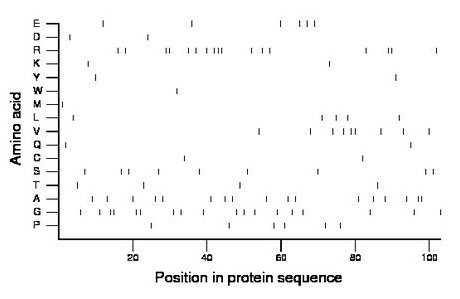
Amino acid Percentage Count Longest homopolymer A alanine 16.5 17 2 C cysteine 1.9 2 1 D aspartate 1.9 2 1 E glutamate 5.8 6 1 F phenylalanine 0.0 0 0 G glycine 17.5 18 2 H histidine 0.0 0 0 I isoleucine 0.0 0 0 K lysine 1.9 2 1 L leucine 4.9 5 1 M methionine 1.0 1 1 N asparagine 0.0 0 0 P proline 5.8 6 1 Q glutamine 1.9 2 1 R arginine 16.5 17 3 S serine 8.7 9 1 T threonine 3.9 4 1 V valine 8.7 9 2 W tryptophan 1.0 1 1 Y tyrosine 1.9 2 1 |
Comparative genomics:
Search single species RefSeq proteins at NCBI
Search summary 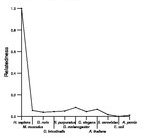
Figure data | ||
Related human proteins:Protein Relative score Description Self-match 1.000 PREDICTED: hypothetical protein LOC100289480 1.000 PREDICTED: hypothetical protein LOC100289480 1.000 PREDICTED: hypothetical protein XP_002342365 LOC100293059 0.066 PREDICTED: hypothetical protein LOC100290935 0.066 PREDICTED: hypothetical protein XP_002348161 LOC100287291 0.066 PREDICTED: hypothetical protein XP_002343834 LOC643355 0.061 PREDICTED: hypothetical protein LOC100292370 0.055 PREDICTED: hypothetical protein SIRT1 0.050 sirtuin 1 isoform a TAF4 0.044 TBP-associated factor 4 PNMAL2 0.044 PNMA-like 2 EWSR1 0.044 Ewing sarcoma breakpoint region 1 isoform 3 EWSR1 0.044 Ewing sarcoma breakpoint region 1 isoform 1 COL5A2 0.044 alpha 2 type V collagen preproprotein TCFL5 0.039 transcription factor-like 5 protein DLEU7 0.039 deleted in lymphocytic leukemia, 7 LOC100288796 0.039 PREDICTED: hypothetical protein LOC100294403 0.039 PREDICTED: hypothetical protein LOC100288796 0.039 PREDICTED: hypothetical protein XP_002343710 LOC388279 0.039 PREDICTED: hypothetical protein COL1A1 0.033 alpha 1 type I collagen preproprotein LOC100293052 0.033 PREDICTED: hypothetical protein LOC100290805 0.033 PREDICTED: hypothetical protein XP_002346730 LOC100289002 0.033 PREDICTED: hypothetical protein XP_002342598 LOC100290023 0.033 PREDICTED: hypothetical protein XP_002348147 FLJ37078 0.033 hypothetical protein LOC222183 C10orf114 0.033 hypothetical protein LOC399726 DVL2 0.028 dishevelled 2 LOC100292592 0.028 PREDICTED: hypothetical protein LOC100289054 0.028 PREDICTED: hypothetical proteinHuman BLASTP results (used to prepare the table) | |||
Gene descriptions are from NCBI RefSeq. Search results were obtained with NCBI BLAST and RefSeq entries. When identical proteins are present, the self-match may not be listed first in BLASTP output. In such cases, the table above has been reordered to place it first.
See About the Figures for the scoring system used in the figure above right. The same scoring system was used in the table of BLASTP results.
Guide to the Human Genome
Copyright © 2010 by Stewart Scherer. All rights reserved.
