
| Name: TMEM158 | Sequence: fasta or formatted (300aa) | NCBI GI: 116805334 | |
|
Description: Ras-induced senescence 1
| Not currently referenced in the text | ||
|
Composition:
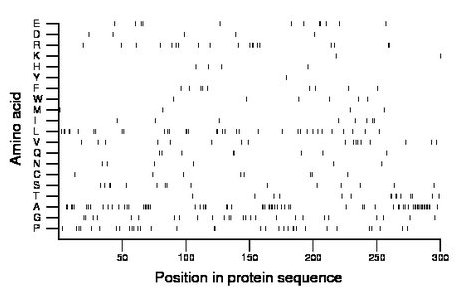
Amino acid Percentage Count Longest homopolymer A alanine 22.3 67 14 C cysteine 2.7 8 2 D aspartate 1.7 5 1 E glutamate 4.0 12 2 F phenylalanine 3.0 9 2 G glycine 8.7 26 2 H histidine 1.3 4 1 I isoleucine 2.7 8 2 K lysine 0.7 2 1 L leucine 11.7 35 3 M methionine 1.3 4 1 N asparagine 2.0 6 1 P proline 11.0 33 2 Q glutamine 2.7 8 2 R arginine 6.3 19 2 S serine 5.0 15 2 T threonine 5.0 15 2 V valine 5.7 17 2 W tryptophan 2.0 6 1 Y tyrosine 0.3 1 1 |
Comparative genomics:
Search single species RefSeq proteins at NCBI
Search summary 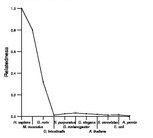
Figure data | ||
Related human proteins:Protein Relative score Description Self-match 1.000 Ras-induced senescence 1 TAF4 0.029 TBP-associated factor 4 LOC100133142 0.024 PREDICTED: similar to zinc finger protein 208 [Homo... LOC100133142 0.024 PREDICTED: similar to zinc finger protein 208 [Homo... FAM48B1 0.024 hypothetical protein LOC100130302 ZSWIM6 0.023 zinc finger, SWIM-type containing 6 LOC100293036 0.023 PREDICTED: hypothetical protein EVX2 0.023 even-skipped homeobox 2 AMOT 0.021 angiomotin isoform 2 AMOT 0.021 angiomotin isoform 1 OLIG1 0.021 oligodendrocyte transcription factor 1 HOXA13 0.019 homeobox A13 FOXD2 0.019 forkhead box D2 PRPF40A 0.019 formin binding protein 3 SHANK1 0.019 SH3 and multiple ankyrin repeat domains 1 LOC642587 0.019 hypothetical protein LOC642587 NPTXR 0.017 neuronal pentraxin receptor SDC3 0.017 syndecan 3 SFRS15 0.017 splicing factor, arginine/serine-rich 15 isoform 3 ... SFRS15 0.017 splicing factor, arginine/serine-rich 15 isoform 2 ... SFRS15 0.017 splicing factor, arginine/serine-rich 15 isoform 1 [... PRDM6 0.017 PR domain containing 6 ZFPM1 0.017 zinc finger protein, multitype 1 PCBP4 0.017 poly(rC) binding protein 4 isoform a PCBP4 0.017 poly(rC) binding protein 4 isoform c PCBP4 0.017 poly(rC) binding protein 4 isoform c DEAF1 0.017 deformed epidermal autoregulatory factor 1 LOC100294411 0.017 PREDICTED: similar to deformed epidermal autoregula... NKX6-1 0.017 NK6 transcription factor related, locus 1 ZBTB4 0.017 zinc finger and BTB domain containing 4Human BLASTP results (used to prepare the table) | |||
Gene descriptions are from NCBI RefSeq. Search results were obtained with NCBI BLAST and RefSeq entries. When identical proteins are present, the self-match may not be listed first in BLASTP output. In such cases, the table above has been reordered to place it first.
See About the Figures for the scoring system used in the figure above right. The same scoring system was used in the table of BLASTP results.
Guide to the Human Genome
Copyright © 2010 by Stewart Scherer. All rights reserved.
