
| Name: OLIG1 | Sequence: fasta or formatted (271aa) | NCBI GI: 237757328 | |
|
Description: oligodendrocyte transcription factor 1
|
Referenced in: Oligodendrocytes and Myelin
| ||
|
Composition:
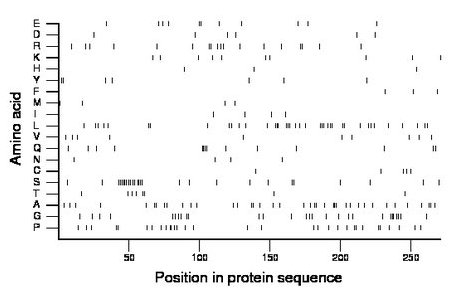
Amino acid Percentage Count Longest homopolymer A alanine 14.4 39 3 C cysteine 1.8 5 1 D aspartate 2.2 6 1 E glutamate 4.1 11 2 F phenylalanine 1.1 3 1 G glycine 10.3 28 3 H histidine 1.1 3 1 I isoleucine 1.5 4 1 K lysine 3.7 10 1 L leucine 14.4 39 3 M methionine 1.5 4 1 N asparagine 1.5 4 1 P proline 11.4 31 2 Q glutamine 5.2 14 4 R arginine 6.6 18 2 S serine 10.0 27 6 T threonine 3.0 8 2 V valine 3.7 10 1 W tryptophan 0.0 0 0 Y tyrosine 2.6 7 2 |
Comparative genomics:
Search single species RefSeq proteins at NCBI
Search summary 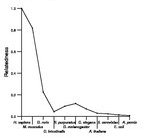
Figure data | ||
Related human proteins:Protein Relative score Description Self-match 1.000 oligodendrocyte transcription factor 1 OLIG2 0.164 oligodendrocyte lineage transcription factor 2 [Homo... OLIG3 0.143 oligodendrocyte transcription factor 3 BHLHE22 0.123 basic helix-loop-helix domain containing, class B, 5... BHLHE23 0.115 basic helix-loop-helix domain containing, class B, 4... BHLHA15 0.078 basic helix-loop-helix family, member a15 TCF15 0.070 basic helix-loop-helix transcription factor 15 [Homo... NEUROD2 0.068 neurogenic differentiation 2 SCXB 0.063 scleraxis homolog B SCXA 0.063 scleraxis homolog A NEUROG3 0.063 neurogenin 3 NEUROG2 0.059 neurogenin 2 TWIST1 0.057 twist NEUROD4 0.057 neurogenic differentiation 4 NEUROG1 0.055 neurogenin 1 NEUROD1 0.053 neurogenic differentiation 1 PTF1A 0.053 pancreas specific transcription factor, 1a TWIST2 0.051 twist homolog 2 ATOH8 0.051 atonal homolog 8 BHLHA9 0.051 PREDICTED: basic helix-loop-helix family, member a9... BHLHA9 0.051 PREDICTED: basic helix-loop-helix family, member a9... ATOH7 0.049 atonal homolog 7 NEUROD6 0.047 neurogenic differentiation 6 MESP1 0.045 mesoderm posterior 1 MSC 0.043 musculin LYL1 0.043 lymphoblastic leukemia derived sequence 1 ATOH1 0.039 atonal homolog 1 BHLHA9 0.037 PREDICTED: basic helix-loop-helix family, member a9... LOC100129654 0.037 PREDICTED: similar to transcription factor 23 [Homo... LOC100129654 0.037 PREDICTED: similar to transcription factor 23 [Homo...Human BLASTP results (used to prepare the table) | |||
Gene descriptions are from NCBI RefSeq. Search results were obtained with NCBI BLAST and RefSeq entries. When identical proteins are present, the self-match may not be listed first in BLASTP output. In such cases, the table above has been reordered to place it first.
See About the Figures for the scoring system used in the figure above right. The same scoring system was used in the table of BLASTP results.
Guide to the Human Genome
Copyright © 2010 by Stewart Scherer. All rights reserved.
