
| Name: FAM126A | Sequence: fasta or formatted (521aa) | NCBI GI: 19923646 | |
|
Description: family with sequence similarity 126, member A
|
Referenced in:
| ||
|
Composition:
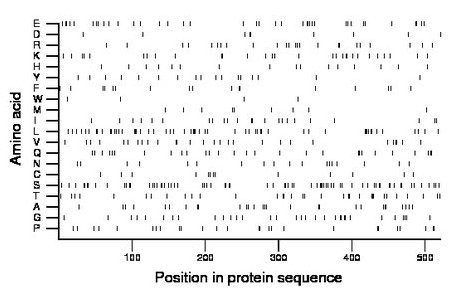
Amino acid Percentage Count Longest homopolymer A alanine 5.4 28 2 C cysteine 2.5 13 1 D aspartate 1.7 9 2 E glutamate 7.5 39 2 F phenylalanine 3.3 17 1 G glycine 6.1 32 2 H histidine 3.1 16 1 I isoleucine 4.4 23 2 K lysine 5.6 29 1 L leucine 10.6 55 3 M methionine 1.9 10 1 N asparagine 3.5 18 1 P proline 5.0 26 2 Q glutamine 5.4 28 2 R arginine 4.6 24 2 S serine 13.6 71 2 T threonine 6.3 33 2 V valine 5.6 29 2 W tryptophan 0.8 4 1 Y tyrosine 3.3 17 1 |
Comparative genomics:
Search single species RefSeq proteins at NCBI
Search summary 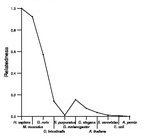
Figure data | ||
Related human proteins:Protein Relative score Description Self-match 1.000 family with sequence similarity 126, member A FAM126B 0.478 hypothetical protein LOC285172 FAM21C 0.014 hypothetical protein LOC253725 FAM21A 0.014 hypothetical protein LOC387680 LOC100170229 0.013 hypothetical protein LOC100170229 FLG 0.010 filaggrin SYNPO2L 0.010 synaptopodin 2-like isoform a SYNPO2L 0.010 synaptopodin 2-like isoform b FAM21B 0.010 hypothetical protein LOC55747 LOC285556 0.010 PREDICTED: hypothetical protein LOC285556 LOC285556 0.010 PREDICTED: hypothetical protein LOC285556 LOC285556 0.010 PREDICTED: hypothetical protein LOC285556 TNRC18 0.009 trinucleotide repeat containing 18 RPTOR 0.008 raptor isoform 1 RPTOR 0.008 raptor isoform 2 MUC21 0.008 mucin 21 CAMSAP1L1 0.007 calmodulin regulated spectrin-associated protein 1-l... SETDB1 0.007 SET domain, bifurcated 1 isoform 2 SETDB1 0.007 SET domain, bifurcated 1 isoform 1 RFC1 0.006 replication factor C large subunit LOC100288562 0.006 PREDICTED: hypothetical protein XP_002342903 LOC100288527 0.006 PREDICTED: hypothetical protein XP_002342902 LOC100288500 0.006 PREDICTED: hypothetical protein XP_002342901 LOC100288470 0.006 PREDICTED: hypothetical protein XP_002342900 LOC100289448 0.006 PREDICTED: hypothetical protein XP_002342913, parti... ATRX 0.006 transcriptional regulator ATRX isoform 2 ATRX 0.006 transcriptional regulator ATRX isoform 1 CCNT2 0.006 cyclin T2 isoform a TLK2 0.006 tousled-like kinase 2 isoform B TLK2 0.006 tousled-like kinase 2 isoform AHuman BLASTP results (used to prepare the table) | |||
Gene descriptions are from NCBI RefSeq. Search results were obtained with NCBI BLAST and RefSeq entries. When identical proteins are present, the self-match may not be listed first in BLASTP output. In such cases, the table above has been reordered to place it first.
See About the Figures for the scoring system used in the figure above right. The same scoring system was used in the table of BLASTP results.
Guide to the Human Genome
Copyright © 2010 by Stewart Scherer. All rights reserved.
