
| Name: AK3 | Sequence: fasta or formatted (227aa) | NCBI GI: 19923437 | |
|
Description: adenylate kinase 3
|
Referenced in: Mitochondria
| ||
|
Composition:
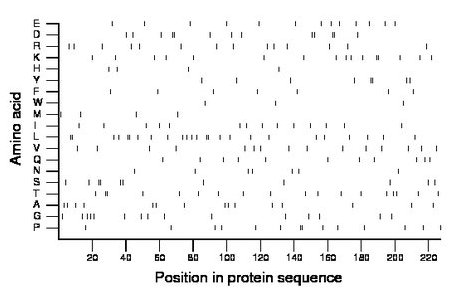
Amino acid Percentage Count Longest homopolymer A alanine 6.6 15 1 C cysteine 0.0 0 0 D aspartate 5.7 13 2 E glutamate 5.7 13 1 F phenylalanine 3.1 7 1 G glycine 6.6 15 1 H histidine 1.8 4 1 I isoleucine 6.2 14 1 K lysine 7.0 16 2 L leucine 11.0 25 2 M methionine 1.8 4 1 N asparagine 3.1 7 1 P proline 6.2 14 2 Q glutamine 4.8 11 1 R arginine 6.2 14 1 S serine 4.8 11 2 T threonine 7.9 18 2 V valine 6.6 15 1 W tryptophan 1.3 3 1 Y tyrosine 3.5 8 2 |
Comparative genomics:
Search single species RefSeq proteins at NCBI
Search summary 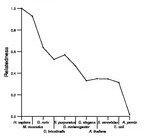
Figure data | ||
Related human proteins:Protein Relative score Description Self-match 1.000 adenylate kinase 3 AK3L1 0.591 adenylate kinase 3-like 1 isoform 7 AK3L1 0.591 adenylate kinase 3-like 1 isoform 5 AK3L1 0.591 adenylate kinase 3-like 1 isoform 6 AK2 0.347 adenylate kinase 2 isoform a AK2 0.347 adenylate kinase 2 isoform b C9orf98 0.149 putative adenylate kinase-like protein C9orf98 [Homo... AK1 0.140 adenylate kinase 1 CMPK1 0.116 UMP-CMP kinase 1 isoform a AK5 0.105 adenylate kinase 5 isoform 1 AK5 0.105 adenylate kinase 5 isoform 2 AKD1 0.072 adenylate kinase domain containing 1 isoform 1 [Hom... AKD1 0.070 adenylate kinase domain containing 1 isoform 2 [Homo... SPEF2 0.028 KPL2 protein isoform 1 CMPK1 0.021 UMP-CMP kinase 1 isoform b TAF9 0.016 TAF9 RNA polymerase II, TATA box binding protein-asso... AK7 0.016 adenylate kinase 7 ERAL1 0.016 Era-like 1 TAF9 0.014 TAF9 RNA polymerase II, TATA box binding protein-ass... DNAH2 0.014 dynein heavy chain domain 3 MAP2K6 0.009 mitogen-activated protein kinase kinase 6 CELSR2 0.009 cadherin EGF LAG seven-pass G-type receptor 2 DNAH1 0.009 dynein, axonemal, heavy chain 1 GPR125 0.009 G protein-coupled receptor 125 KRT80 0.007 keratin 80 isoform a KRT80 0.007 keratin 80 isoform b PKD1L2 0.007 polycystin 1-like 2 isoform c PKD1L2 0.007 polycystin 1-like 2 isoform a SIPA1L2 0.007 signal-induced proliferation-associated 1 like 2 [H...Human BLASTP results (used to prepare the table) | |||
Gene descriptions are from NCBI RefSeq. Search results were obtained with NCBI BLAST and RefSeq entries. When identical proteins are present, the self-match may not be listed first in BLASTP output. In such cases, the table above has been reordered to place it first.
See About the Figures for the scoring system used in the figure above right. The same scoring system was used in the table of BLASTP results.
Guide to the Human Genome
Copyright © 2010 by Stewart Scherer. All rights reserved.
