
| Name: SYNGAP1 | Sequence: fasta or formatted (1343aa) | NCBI GI: 194248068 | |
|
Description: synaptic Ras GTPase activating protein 1
|
Referenced in:
| ||
|
Composition:
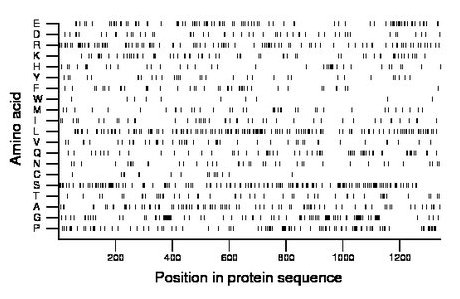
Amino acid Percentage Count Longest homopolymer A alanine 6.5 87 2 C cysteine 1.3 17 2 D aspartate 3.9 53 2 E glutamate 7.0 94 3 F phenylalanine 3.0 40 1 G glycine 8.6 116 7 H histidine 3.4 45 10 I isoleucine 3.6 48 2 K lysine 4.8 65 2 L leucine 10.3 139 2 M methionine 2.9 39 2 N asparagine 2.9 39 2 P proline 8.1 109 6 Q glutamine 4.5 61 3 R arginine 7.7 104 2 S serine 10.9 146 3 T threonine 3.8 51 2 V valine 3.6 48 2 W tryptophan 0.7 10 1 Y tyrosine 2.4 32 2 |
Comparative genomics:
Search single species RefSeq proteins at NCBI
Search summary 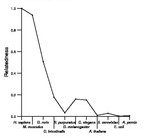
Figure data | ||
Related human proteins:Protein Relative score Description Self-match 1.000 synaptic Ras GTPase activating protein 1 DAB2IP 0.389 disabled homolog 2 interacting protein isoform 1 [Ho... DAB2IP 0.369 disabled homolog 2 interacting protein isoform 2 [Ho... RASAL2 0.368 RAS protein activator like 2 isoform 2 RASAL2 0.350 RAS protein activator like 2 isoform 1 RASAL3 0.143 RAS protein activator like 3 RASA1 0.046 RAS p21 protein activator 1 isoform 1 RASA1 0.046 RAS p21 protein activator 1 isoform 2 RASA3 0.037 RAS p21 protein activator 3 LOC100132214 0.033 PREDICTED: similar to calcium-promoted Ras inactiva... LOC100132214 0.033 PREDICTED: similar to calcium-promoted Ras inactiva... LOC100132214 0.033 PREDICTED: similar to calcium-promoted Ras inactiva... LOC100132214 0.033 PREDICTED: similar to calcium-promoted Ras inactiva... RASA4 0.033 RAS p21 protein activator 4 isoform 2 RASA4 0.033 RAS p21 protein activator 4 isoform 1 RASA2 0.032 RAS p21 protein activator 2 RASAL1 0.031 RAS protein activator like 1 NF1 0.026 neurofibromin isoform 2 NF1 0.025 neurofibromin isoform 1 LOC647042 0.014 PREDICTED: hypothetical protein isoform 1 SHANK1 0.014 SH3 and multiple ankyrin repeat domains 1 LOC100133220 0.013 PREDICTED: hypothetical protein YY1 0.013 YY1 transcription factor ARID1B 0.012 AT rich interactive domain 1B (SWI1-like) isoform 2 ... ARID1B 0.012 AT rich interactive domain 1B (SWI1-like) isoform 1 ... ARID1B 0.012 AT rich interactive domain 1B (SWI1-like) isoform 3 ... ATN1 0.012 atrophin-1 ATN1 0.012 atrophin-1 FUS 0.012 fusion (involved in t(12;16) in malignant liposarcoma... CACNA1A 0.011 calcium channel, alpha 1A subunit isoform 4Human BLASTP results (used to prepare the table) | |||
Gene descriptions are from NCBI RefSeq. Search results were obtained with NCBI BLAST and RefSeq entries. When identical proteins are present, the self-match may not be listed first in BLASTP output. In such cases, the table above has been reordered to place it first.
See About the Figures for the scoring system used in the figure above right. The same scoring system was used in the table of BLASTP results.
Guide to the Human Genome
Copyright © 2010 by Stewart Scherer. All rights reserved.
