| Name: GSPT1 | Sequence: fasta or formatted (499aa) | NCBI GI: 194018522 | |
|
Description: G1 to S phase transition 1 isoform 3
|
Referenced in:
| ||
Other entries for this name:
alt prot [637aa] G1 to S phase transition 1 isoform 1 alt prot [636aa] G1 to S phase transition 1 isoform 2 | |||
|
Composition:

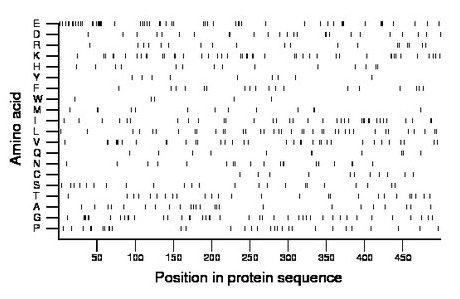
Amino acid Percentage Count Longest homopolymer A alanine 4.8 24 1 C cysteine 2.2 11 1 D aspartate 5.0 25 2 E glutamate 11.2 56 5 F phenylalanine 3.6 18 1 G glycine 8.4 42 3 H histidine 2.8 14 1 I isoleucine 7.0 35 2 K lysine 9.0 45 2 L leucine 7.6 38 1 M methionine 2.8 14 2 N asparagine 3.8 19 2 P proline 6.0 30 2 Q glutamine 2.2 11 2 R arginine 3.8 19 1 S serine 4.6 23 1 T threonine 5.2 26 1 V valine 7.0 35 2 W tryptophan 1.0 5 1 Y tyrosine 1.8 9 1 |
Comparative genomics:
Search single species RefSeq proteins at NCBI
Search summary 
Figure data | ||
Related human proteins:Protein Relative score Description Self-match 1.000 G1 to S phase transition 1 isoform 3 GSPT1 1.000 G1 to S phase transition 1 isoform 1 GSPT1 0.994 G1 to S phase transition 1 isoform 2 GSPT2 0.937 peptide chain release factor 3 HBS1L 0.321 Hsp70 subfamily B suppressor 1-like protein isoform... HBS1L 0.321 Hsp70 subfamily B suppressor 1-like protein isoform 1... EEF1A1 0.288 eukaryotic translation elongation factor 1 alpha 1 [H... EEF1A2 0.283 eukaryotic translation elongation factor 1 alpha 2 [H... LOC100293909 0.249 PREDICTED: similar to eukaryotic translation elonga... TUFM 0.092 Tu translation elongation factor, mitochondrial prec... GTPBP1 0.050 GTP binding protein 1 LOC729856 0.048 PREDICTED: similar to hCG1981735 LOC729856 0.048 PREDICTED: similar to hCG1981735 LOC729856 0.047 PREDICTED: similar to hCG1981735 GTPBP2 0.039 GTP binding protein 2 LOC643563 0.033 PREDICTED: similar to EEF1A1 protein LOC643563 0.033 PREDICTED: similar to EEF1A1 protein LOC643563 0.033 PREDICTED: similar to EEF1A1 protein EEFSEC 0.032 eukaryotic elongation factor, selenocysteine-tRNA-sp... GUF1 0.029 GUF1 GTPase homolog MTIF2 0.027 mitochondrial translational initiation factor 2 prec... MTIF2 0.027 mitochondrial translational initiation factor 2 prec... GFM1 0.027 G elongation factor, mitochondrial 1 EIF2S3 0.026 eukaryotic translation initiation factor 2, subunit 3... GFM2 0.019 mitochondrial elongation factor G2 isoform 2 GFM2 0.019 mitochondrial elongation factor G2 isoform 3 GFM2 0.019 mitochondrial elongation factor G2 isoform 1 EIF5B 0.019 eukaryotic translation initiation factor 5B PRKCSH 0.012 protein kinase C substrate 80K-H isoform 2 PRKCSH 0.012 protein kinase C substrate 80K-H isoform 1Human BLASTP results (used to prepare the table) | |||
Gene descriptions are from NCBI RefSeq. Search results were obtained with NCBI BLAST and RefSeq entries. When identical proteins are present, the self-match may not be listed first in BLASTP output. In such cases, the table above has been reordered to place it first.
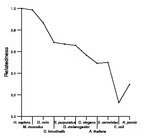
See About the Figures for the scoring system used in the figure above right. The same scoring system was used in the table of BLASTP results.
Guide to the Human Genome
Copyright © 2010 by Stewart Scherer. All rights reserved.
