
| Name: NAF1 | Sequence: fasta or formatted (494aa) | NCBI GI: 193083157 | |
|
Description: nuclear assembly factor 1 homolog isoform a
|
Referenced in:
| ||
Other entries for this name:
alt prot [389aa] nuclear assembly factor 1 homolog isoform b | |||
|
Composition:
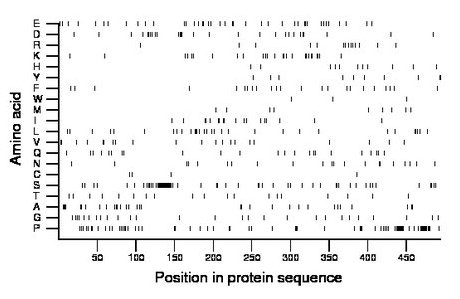
Amino acid Percentage Count Longest homopolymer A alanine 6.7 33 4 C cysteine 0.8 4 1 D aspartate 5.7 28 3 E glutamate 8.1 40 2 F phenylalanine 4.7 23 1 G glycine 5.5 27 1 H histidine 2.2 11 1 I isoleucine 3.6 18 2 K lysine 5.3 26 2 L leucine 6.3 31 3 M methionine 2.0 10 1 N asparagine 4.3 21 2 P proline 14.4 71 9 Q glutamine 4.7 23 1 R arginine 2.8 14 1 S serine 12.3 61 18 T threonine 3.8 19 1 V valine 4.3 21 2 W tryptophan 0.6 3 1 Y tyrosine 2.0 10 2 |
Comparative genomics:
Search single species RefSeq proteins at NCBI
Search summary 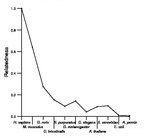
Figure data | ||
Related human proteins:Protein Relative score Description Self-match 1.000 nuclear assembly factor 1 homolog isoform a NAF1 0.662 nuclear assembly factor 1 homolog isoform b PCLO 0.040 piccolo isoform 2 PCLO 0.040 piccolo isoform 1 WASF2 0.036 WAS protein family, member 2 ZFHX4 0.034 zinc finger homeodomain 4 SRRM2 0.033 splicing coactivator subunit SRm300 PRR12 0.032 proline rich 12 SETD1B 0.031 SET domain containing 1B FMN1 0.030 formin 1 ZNF341 0.030 zinc finger protein 341 YLPM1 0.030 YLP motif containing 1 HTT 0.029 huntingtin FMNL2 0.029 formin-like 2 WASF1 0.029 Wiskott-Aldrich syndrome protein family member 1 [Ho... WASF1 0.029 Wiskott-Aldrich syndrome protein family member 1 [Ho... WASF1 0.029 Wiskott-Aldrich syndrome protein family member 1 [Ho... WASF1 0.029 Wiskott-Aldrich syndrome protein family member 1 [Hom... WAS 0.029 Wiskott-Aldrich syndrome protein FMNL1 0.028 formin-like 1 ENAH 0.027 enabled homolog isoform a ENAH 0.027 enabled homolog isoform b TNRC18 0.027 trinucleotide repeat containing 18 FHDC1 0.027 FH2 domain containing 1 ASXL3 0.027 additional sex combs like 3 SETD1A 0.025 SET domain containing 1A DSPP 0.025 dentin sialophosphoprotein preproprotein CBLL1 0.025 Cas-Br-M (murine) ecotropic retroviral transforming... FASLG 0.025 fas ligand EIF3B 0.025 eukaryotic translation initiation factor 3, subunit ...Human BLASTP results (used to prepare the table) | |||
Gene descriptions are from NCBI RefSeq. Search results were obtained with NCBI BLAST and RefSeq entries. When identical proteins are present, the self-match may not be listed first in BLASTP output. In such cases, the table above has been reordered to place it first.
See About the Figures for the scoring system used in the figure above right. The same scoring system was used in the table of BLASTP results.
Guide to the Human Genome
Copyright © 2010 by Stewart Scherer. All rights reserved.
