
| Name: AZI1 | Sequence: fasta or formatted (1080aa) | NCBI GI: 111955084 | |
|
Description: 5-azacytidine induced 1 isoform a
|
Referenced in:
| ||
Other entries for this name:
alt prot [1044aa] 5-azacytidine induced 1 isoform b | |||
|
Composition:
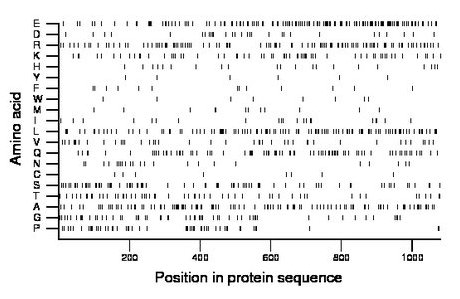
Amino acid Percentage Count Longest homopolymer A alanine 10.3 111 2 C cysteine 0.7 8 1 D aspartate 2.9 31 2 E glutamate 13.1 142 3 F phenylalanine 1.2 13 1 G glycine 5.3 57 3 H histidine 2.0 22 2 I isoleucine 2.0 22 2 K lysine 6.1 66 2 L leucine 10.6 114 3 M methionine 1.2 13 2 N asparagine 2.6 28 2 P proline 5.0 54 3 Q glutamine 8.4 91 3 R arginine 10.7 116 2 S serine 7.4 80 3 T threonine 5.1 55 2 V valine 4.0 43 2 W tryptophan 0.7 8 1 Y tyrosine 0.6 6 1 |
Comparative genomics:
Search single species RefSeq proteins at NCBI
Search summary 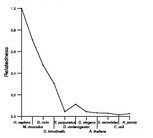
Figure data | ||
Related human proteins:Protein Relative score Description Self-match 1.000 5-azacytidine induced 1 isoform a AZI1 0.953 5-azacytidine induced 1 isoform b PLEC1 0.060 plectin 1 isoform 11 PLEC1 0.060 plectin 1 isoform 10 PLEC1 0.060 plectin 1 isoform 8 PLEC1 0.060 plectin 1 isoform 7 PLEC1 0.060 plectin 1 isoform 6 PLEC1 0.060 plectin 1 isoform 3 PLEC1 0.060 plectin 1 isoform 2 PLEC1 0.060 plectin 1 isoform 1 TCHH 0.060 trichohyalin MYH14 0.044 myosin, heavy chain 14 isoform 1 MYH14 0.044 myosin, heavy chain 14 isoform 2 MYH14 0.044 myosin, heavy chain 14 isoform 3 MYH10 0.044 myosin, heavy polypeptide 10, non-muscle LOC727832 0.043 golgi autoantigen, golgin subfamily a-like MYH7B 0.042 myosin, heavy polypeptide 7B, cardiac muscle, beta ... CROCC 0.040 ciliary rootlet coiled-coil LOC283767 0.040 golgi autoantigen, golgin subfamily a-like CEP250 0.040 centrosomal protein 2 CGN 0.040 cingulin MYH9 0.040 myosin, heavy polypeptide 9, non-muscle LOC440243 0.039 PREDICTED: Putative golgin subfamily A member 6-lik... GOLGA4 0.039 golgi autoantigen, golgin subfamily a, 4 MYH8 0.039 myosin, heavy chain 8, skeletal muscle, perinatal [... CCDC88B 0.039 coiled-coil domain containing 88 MYH3 0.039 myosin, heavy chain 3, skeletal muscle, embryonic [H... MYH11 0.039 smooth muscle myosin heavy chain 11 isoform SM1A [Ho... MYH11 0.039 smooth muscle myosin heavy chain 11 isoform SM1B [Ho... MYH11 0.039 smooth muscle myosin heavy chain 11 isoform SM2B [Ho...Human BLASTP results (used to prepare the table) | |||
Gene descriptions are from NCBI RefSeq. Search results were obtained with NCBI BLAST and RefSeq entries. When identical proteins are present, the self-match may not be listed first in BLASTP output. In such cases, the table above has been reordered to place it first.
See About the Figures for the scoring system used in the figure above right. The same scoring system was used in the table of BLASTP results.
Guide to the Human Genome
Copyright © 2010 by Stewart Scherer. All rights reserved.
