
| Name: WEE2 | Sequence: fasta or formatted (567aa) | NCBI GI: 157738687 | |
|
Description: WEE1 homolog 2
|
Referenced in: Spindle, M phase, and Meiosis
| ||
|
Composition:
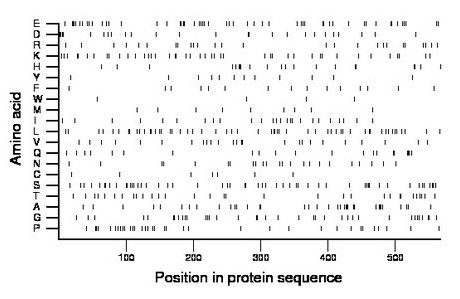
Amino acid Percentage Count Longest homopolymer A alanine 6.3 36 3 C cysteine 1.2 7 1 D aspartate 4.4 25 2 E glutamate 9.9 56 2 F phenylalanine 2.6 15 1 G glycine 6.7 38 2 H histidine 3.7 21 2 I isoleucine 4.6 26 2 K lysine 7.8 44 2 L leucine 9.5 54 2 M methionine 1.8 10 1 N asparagine 4.1 23 1 P proline 6.2 35 2 Q glutamine 3.9 22 3 R arginine 4.6 26 1 S serine 9.9 56 3 T threonine 5.5 31 1 V valine 4.4 25 2 W tryptophan 0.7 4 1 Y tyrosine 2.3 13 2 |
Comparative genomics:
Search single species RefSeq proteins at NCBI
Search summary 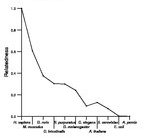
Figure data | ||
Related human proteins:Protein Relative score Description Self-match 1.000 WEE1 homolog 2 WEE1 0.367 WEE1 tyrosine kinase isoform 1 WEE1 0.356 WEE1 tyrosine kinase isoform 2 PKMYT1 0.099 protein kinase Myt1 isoform 2 PKMYT1 0.099 protein kinase Myt1 isoform 1 MYO3B 0.058 myosin IIIB isoform 1 MYO3B 0.058 myosin IIIB isoform 2 NEK1 0.057 NIMA-related kinase 1 STK4 0.053 serine/threonine kinase 4 NEK4 0.052 NIMA-related kinase 4 NEK3 0.052 NIMA-related kinase 3 isoform b NEK3 0.052 NIMA-related kinase 3 isoform a NEK3 0.052 NIMA-related kinase 3 isoform a STK24 0.051 serine/threonine kinase 24 isoform a NEK11 0.051 NIMA-related kinase 11 isoform 2 NEK11 0.051 NIMA-related kinase 11 isoform 3 NEK11 0.051 NIMA-related kinase 11 isoform 1 MST4 0.050 serine/threonine protein kinase MST4 isoform 1 [Homo... NEK7 0.050 NIMA-related kinase 7 STK24 0.050 serine/threonine kinase 24 isoform b OXSR1 0.049 oxidative-stress responsive 1 STK3 0.049 serine/threonine kinase 3 MYO3A 0.049 myosin IIIA NEK5 0.049 NIMA-related kinase 5 NEK8 0.048 NIMA-related kinase 8 STK25 0.048 serine/threonine kinase 25 MAP3K4 0.048 mitogen-activated protein kinase kinase kinase 4 iso... MAP3K4 0.048 mitogen-activated protein kinase kinase kinase 4 iso... DCLK2 0.048 doublecortin-like kinase 2 isoform b NEK2 0.046 NIMA-related kinase 2Human BLASTP results (used to prepare the table) | |||
Gene descriptions are from NCBI RefSeq. Search results were obtained with NCBI BLAST and RefSeq entries. When identical proteins are present, the self-match may not be listed first in BLASTP output. In such cases, the table above has been reordered to place it first.
See About the Figures for the scoring system used in the figure above right. The same scoring system was used in the table of BLASTP results.
Guide to the Human Genome
Copyright © 2010 by Stewart Scherer. All rights reserved.
