
| Name: NF-E4 | Sequence: fasta or formatted (179aa) | NCBI GI: 145976942 | |
|
Description: transcription factor NF-E4
|
Referenced in: Hematopoiesis and Erythrocytes
| ||
|
Composition:
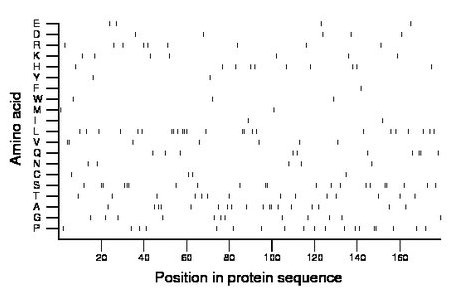
Amino acid Percentage Count Longest homopolymer A alanine 10.1 18 2 C cysteine 2.2 4 1 D aspartate 2.8 5 1 E glutamate 2.2 4 1 F phenylalanine 0.6 1 1 G glycine 6.7 12 1 H histidine 5.6 10 1 I isoleucine 1.1 2 1 K lysine 3.9 7 1 L leucine 13.4 24 3 M methionine 1.1 2 1 N asparagine 2.8 5 1 P proline 10.6 19 2 Q glutamine 5.6 10 2 R arginine 5.0 9 1 S serine 11.7 21 3 T threonine 7.8 14 1 V valine 3.9 7 2 W tryptophan 1.7 3 1 Y tyrosine 1.1 2 1 |
Comparative genomics:
Search single species RefSeq proteins at NCBI
Search summary 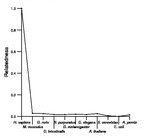
Figure data | ||
Related human proteins:Protein Relative score Description Self-match 1.000 transcription factor NF-E4 WNK2 0.023 WNK lysine deficient protein kinase 2 CD68 0.020 CD68 antigen isoform B CD68 0.020 CD68 antigen isoform A CCDC120 0.020 coiled-coil domain containing 120 isoform 3 CCDC120 0.020 coiled-coil domain containing 120 isoform 4 CCDC120 0.020 coiled-coil domain containing 120 isoform 2 CCDC120 0.020 coiled-coil domain containing 120 isoform 1 PLXNB1 0.020 plexin B1 PLXNB1 0.020 plexin B1 LOC100293930 0.014 PREDICTED: hypothetical protein LOC100287415 0.014 PREDICTED: hypothetical protein LOC100287415 0.014 PREDICTED: hypothetical protein XP_002343291 FAM100A 0.014 hypothetical protein LOC124402 ZMIZ1 0.014 retinoic acid induced 17 RERE 0.014 atrophin-1 like protein isoform b RERE 0.014 atrophin-1 like protein isoform a RERE 0.014 atrophin-1 like protein isoform a MUC17 0.014 mucin 17 NFATC3 0.012 nuclear factor of activated T-cells, cytoplasmic, ca... NFATC3 0.012 nuclear factor of activated T-cells, cytoplasmic, ca... NFATC3 0.012 nuclear factor of activated T-cells, cytoplasmic, ca... NFATC3 0.012 nuclear factor of activated T-cells, cytoplasmic, cal... LOC100293485 0.012 PREDICTED: hypothetical protein DMWD 0.012 dystrophia myotonica-containing WD repeat motif prot... IL15RA 0.012 interleukin 15 receptor, alpha isoform 1 precursor [H... IL15RA 0.012 interleukin 15 receptor, alpha isoform 2 ATXN7 0.012 ataxin 7 isoform b ATXN7 0.012 ataxin 7 isoform a PRRT1 0.012 NG5 proteinHuman BLASTP results (used to prepare the table) | |||
Gene descriptions are from NCBI RefSeq. Search results were obtained with NCBI BLAST and RefSeq entries. When identical proteins are present, the self-match may not be listed first in BLASTP output. In such cases, the table above has been reordered to place it first.
See About the Figures for the scoring system used in the figure above right. The same scoring system was used in the table of BLASTP results.
Guide to the Human Genome
Copyright © 2010 by Stewart Scherer. All rights reserved.
