
| Name: MRPS26 | Sequence: fasta or formatted (205aa) | NCBI GI: 14269586 | |
|
Description: mitochondrial ribosomal protein S26
|
Referenced in:
| ||
|
Composition:
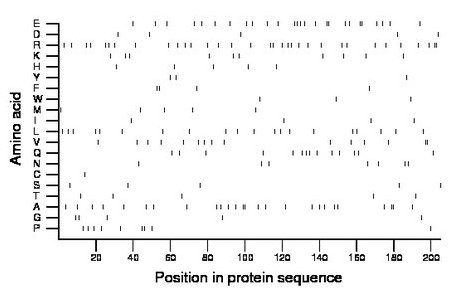
Amino acid Percentage Count Longest homopolymer A alanine 12.7 26 2 C cysteine 0.5 1 1 D aspartate 2.4 5 1 E glutamate 12.7 26 2 F phenylalanine 2.0 4 2 G glycine 2.4 5 1 H histidine 2.4 5 1 I isoleucine 2.0 4 1 K lysine 4.9 10 1 L leucine 9.8 20 1 M methionine 2.4 5 1 N asparagine 3.4 7 1 P proline 4.4 9 2 Q glutamine 6.8 14 1 R arginine 16.1 33 2 S serine 2.4 5 1 T threonine 2.4 5 1 V valine 7.3 15 2 W tryptophan 1.5 3 1 Y tyrosine 1.5 3 1 |
Comparative genomics:
Search single species RefSeq proteins at NCBI
Search summary 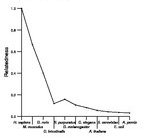
Figure data | ||
Related human proteins:Protein Relative score Description Self-match 1.000 mitochondrial ribosomal protein S26 EIF3A 0.069 eukaryotic translation initiation factor 3, subunit 1... GIGYF2 0.055 GRB10 interacting GYF protein 2 isoform c GIGYF2 0.055 GRB10 interacting GYF protein 2 isoform a GIGYF2 0.055 GRB10 interacting GYF protein 2 isoform b GIGYF2 0.055 GRB10 interacting GYF protein 2 isoform b PLEC1 0.055 plectin 1 isoform 11 PLEC1 0.055 plectin 1 isoform 10 PLEC1 0.055 plectin 1 isoform 8 PLEC1 0.055 plectin 1 isoform 7 PLEC1 0.055 plectin 1 isoform 6 PLEC1 0.055 plectin 1 isoform 3 PLEC1 0.055 plectin 1 isoform 2 PLEC1 0.055 plectin 1 isoform 1 DNAJC2 0.055 DnaJ (Hsp40) homolog, subfamily C, member 2 isoform... CALD1 0.053 caldesmon 1 isoform 1 MYO10 0.050 myosin X MAP4K4 0.047 mitogen-activated protein kinase kinase kinase kinas... MAP4K4 0.047 mitogen-activated protein kinase kinase kinase kinas... MAP4K4 0.047 mitogen-activated protein kinase kinase kinase kinas... INCENP 0.047 inner centromere protein antigens 135/155kDa isofor... INCENP 0.047 inner centromere protein antigens 135/155kDa isofor... TNIK 0.047 TRAF2 and NCK interacting kinase isoform 8 TNIK 0.047 TRAF2 and NCK interacting kinase isoform 7 TNIK 0.047 TRAF2 and NCK interacting kinase isoform 4 TNIK 0.047 TRAF2 and NCK interacting kinase isoform 3 MAP7 0.047 microtubule-associated protein 7 CCDC11 0.047 coiled-coil domain containing 11 LOC653125 0.045 PREDICTED: similar to Golgin subfamily A member 8-l... LOC728498 0.045 PREDICTED: similar to Golgin subfamily A member 8-l...Human BLASTP results (used to prepare the table) | |||
Gene descriptions are from NCBI RefSeq. Search results were obtained with NCBI BLAST and RefSeq entries. When identical proteins are present, the self-match may not be listed first in BLASTP output. In such cases, the table above has been reordered to place it first.
See About the Figures for the scoring system used in the figure above right. The same scoring system was used in the table of BLASTP results.
Guide to the Human Genome
Copyright © 2010 by Stewart Scherer. All rights reserved.
