
| Name: GPR173 | Sequence: fasta or formatted (373aa) | NCBI GI: 9507143 | |
|
Description: G protein-coupled receptor 173
|
Referenced in:
| ||
|
Composition:
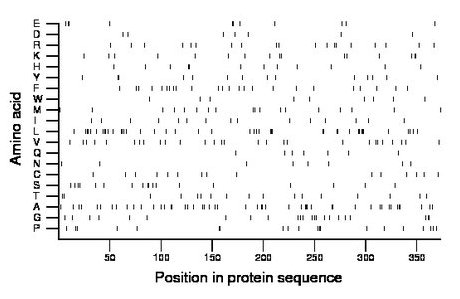
Amino acid Percentage Count Longest homopolymer A alanine 13.1 49 3 C cysteine 4.0 15 1 D aspartate 1.9 7 1 E glutamate 2.9 11 2 F phenylalanine 6.4 24 1 G glycine 6.2 23 2 H histidine 3.2 12 2 I isoleucine 4.0 15 1 K lysine 4.3 16 2 L leucine 11.5 43 3 M methionine 4.8 18 1 N asparagine 2.1 8 1 P proline 5.4 20 2 Q glutamine 1.9 7 1 R arginine 5.1 19 2 S serine 4.8 18 2 T threonine 4.6 17 2 V valine 7.5 28 1 W tryptophan 2.4 9 1 Y tyrosine 3.8 14 2 |
Comparative genomics:
Search single species RefSeq proteins at NCBI
Search summary 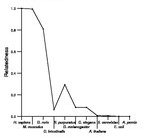
Figure data | ||
Related human proteins:Protein Relative score Description Self-match 1.000 G protein-coupled receptor 173 GPR85 0.631 G protein-coupled receptor 85 GPR85 0.631 G protein-coupled receptor 85 GPR85 0.631 G protein-coupled receptor 85 GPR85 0.631 G protein-coupled receptor 85 GPR27 0.501 G protein-coupled receptor 27 DRD3 0.086 dopamine receptor D3 isoform a HTR2A 0.086 5-hydroxytryptamine (serotonin) receptor 2A CCKBR 0.082 cholecystokinin B receptor HTR7 0.080 5-hydroxytryptamine receptor 7 isoform b HTR7 0.080 5-hydroxytryptamine receptor 7 isoform d HTR7 0.080 5-hydroxytryptamine receptor 7 isoform a HTR2B 0.080 5-hydroxytryptamine (serotonin) receptor 2B CCKAR 0.078 cholecystokinin A receptor DRD3 0.076 dopamine receptor D3 isoform e HTR1F 0.074 5-hydroxytryptamine (serotonin) receptor 1F HTR2C 0.072 5-hydroxytryptamine (serotonin) receptor 2C ADRB1 0.070 beta-1-adrenergic receptor GALR3 0.068 galanin receptor 3 ADRA1A 0.068 alpha-1A-adrenergic receptor isoform 4 ADRA1A 0.068 alpha-1A-adrenergic receptor isoform 1 ADRA1A 0.068 alpha-1A-adrenergic receptor isoform 2 ADRA1A 0.068 alpha-1A-adrenergic receptor isoform 3 HTR1A 0.067 5-hydroxytryptamine (serotonin) receptor 1A MTNR1B 0.067 melatonin receptor 1B ADRA2A 0.067 alpha-2A-adrenergic receptor HTR1B 0.066 5-hydroxytryptamine (serotonin) receptor 1B ADRA2C 0.066 alpha-2C-adrenergic receptor HTR5A 0.066 5-hydroxytryptamine receptor 5A HTR1D 0.066 5-hydroxytryptamine (serotonin) receptor 1DHuman BLASTP results (used to prepare the table) | |||
Gene descriptions are from NCBI RefSeq. Search results were obtained with NCBI BLAST and RefSeq entries. When identical proteins are present, the self-match may not be listed first in BLASTP output. In such cases, the table above has been reordered to place it first.
See About the Figures for the scoring system used in the figure above right. The same scoring system was used in the table of BLASTP results.
Guide to the Human Genome
Copyright © 2010 by Stewart Scherer. All rights reserved.
