
| Name: TCP1 | Sequence: fasta or formatted (556aa) | NCBI GI: 57863257 | |
|
Description: T-complex protein 1 isoform a
|
Referenced in: Heat-Shock Proteins and Chaperonins
| ||
Other entries for this name:
alt prot [401aa] T-complex protein 1 isoform b | |||
|
Composition:
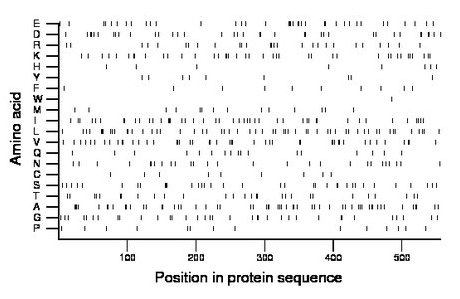
Amino acid Percentage Count Longest homopolymer A alanine 10.3 57 3 C cysteine 1.6 9 1 D aspartate 6.7 37 2 E glutamate 6.7 37 2 F phenylalanine 2.0 11 2 G glycine 6.5 36 3 H histidine 1.4 8 1 I isoleucine 8.1 45 2 K lysine 7.2 40 1 L leucine 10.1 56 2 M methionine 2.7 15 1 N asparagine 4.9 27 1 P proline 2.5 14 1 Q glutamine 3.1 17 1 R arginine 4.9 27 2 S serine 6.5 36 2 T threonine 5.0 28 2 V valine 8.3 46 2 W tryptophan 0.2 1 1 Y tyrosine 1.6 9 1 |
Comparative genomics:
Search single species RefSeq proteins at NCBI
Search summary 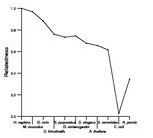
Figure data | ||
Related human proteins:Protein Relative score Description Self-match 1.000 T-complex protein 1 isoform a TCP1 0.717 T-complex protein 1 isoform b CCT7 0.266 chaperonin containing TCP1, subunit 7 isoform a [Homo... CCT2 0.258 chaperonin containing TCP1, subunit 2 CCT3 0.250 chaperonin containing TCP1, subunit 3 isoform a [Hom... CCT3 0.244 chaperonin containing TCP1, subunit 3 isoform b [Hom... CCT4 0.241 chaperonin containing TCP1, subunit 4 (delta) CCT5 0.232 chaperonin containing TCP1, subunit 5 (epsilon) [Hom... CCT8 0.211 chaperonin containing TCP1, subunit 8 (theta) CCT6B 0.208 chaperonin containing TCP1, subunit 6B CCT6A 0.208 chaperonin containing TCP1, subunit 6A isoform a [Hom... CCT3 0.205 chaperonin containing TCP1, subunit 3 isoform c [Hom... CCT6A 0.150 chaperonin containing TCP1, subunit 6A isoform b [Ho... CCT7 0.142 chaperonin containing TCP1, subunit 7 isoform b [Hom... CCT8L2 0.093 T-complex protein 1 HSPD1 0.032 chaperonin HSPD1 0.032 chaperonin BBS10 0.023 Bardet-Biedl syndrome 10 MKKS 0.014 McKusick-Kaufman syndrome protein MKKS 0.014 McKusick-Kaufman syndrome protein GLYATL1 0.008 glycine-N-acyltransferase-like 1 C14orf166 0.007 homeobox prox 1 MLH3 0.004 mutL homolog 3 isoform 1 CMYA5 0.004 cardiomyopathy associated 5 NOL8 0.004 nucleolar protein 8Human BLASTP results (used to prepare the table) | |||
Gene descriptions are from NCBI RefSeq. Search results were obtained with NCBI BLAST and RefSeq entries. When identical proteins are present, the self-match may not be listed first in BLASTP output. In such cases, the table above has been reordered to place it first.
See About the Figures for the scoring system used in the figure above right. The same scoring system was used in the table of BLASTP results.
Guide to the Human Genome
Copyright © 2010 by Stewart Scherer. All rights reserved.
