
| Name: CCT2 | Sequence: fasta or formatted (535aa) | NCBI GI: 5453603 | |
|
Description: chaperonin containing TCP1, subunit 2
|
Referenced in: Heat-Shock Proteins and Chaperonins
| ||
|
Composition:
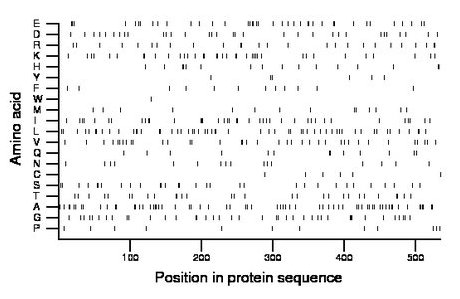
Amino acid Percentage Count Longest homopolymer A alanine 12.3 66 2 C cysteine 1.1 6 1 D aspartate 6.2 33 2 E glutamate 7.3 39 2 F phenylalanine 2.2 12 1 G glycine 7.9 42 3 H histidine 3.0 16 2 I isoleucine 7.7 41 2 K lysine 6.9 37 2 L leucine 10.5 56 2 M methionine 2.8 15 1 N asparagine 3.0 16 1 P proline 2.2 12 1 Q glutamine 2.4 13 2 R arginine 4.9 26 1 S serine 5.8 31 2 T threonine 5.6 30 2 V valine 6.9 37 1 W tryptophan 0.2 1 1 Y tyrosine 1.1 6 1 |
Comparative genomics:
Search single species RefSeq proteins at NCBI
Search summary 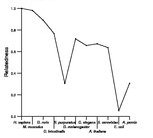
Figure data | ||
Related human proteins:Protein Relative score Description Self-match 1.000 chaperonin containing TCP1, subunit 2 CCT7 0.271 chaperonin containing TCP1, subunit 7 isoform a [Homo... TCP1 0.268 T-complex protein 1 isoform a CCT5 0.247 chaperonin containing TCP1, subunit 5 (epsilon) [Hom... CCT4 0.235 chaperonin containing TCP1, subunit 4 (delta) CCT3 0.201 chaperonin containing TCP1, subunit 3 isoform a [Hom... CCT3 0.195 chaperonin containing TCP1, subunit 3 isoform b [Hom... CCT6B 0.191 chaperonin containing TCP1, subunit 6B CCT6A 0.188 chaperonin containing TCP1, subunit 6A isoform a [Hom... CCT3 0.170 chaperonin containing TCP1, subunit 3 isoform c [Hom... CCT8 0.166 chaperonin containing TCP1, subunit 8 (theta) TCP1 0.149 T-complex protein 1 isoform b CCT6A 0.136 chaperonin containing TCP1, subunit 6A isoform b [Ho... CCT7 0.134 chaperonin containing TCP1, subunit 7 isoform b [Hom... CCT8L2 0.119 T-complex protein 1 HSPD1 0.061 chaperonin HSPD1 0.061 chaperonin MKKS 0.024 McKusick-Kaufman syndrome protein MKKS 0.024 McKusick-Kaufman syndrome protein BBS10 0.022 Bardet-Biedl syndrome 10 PIKFYVE 0.017 phosphatidylinositol-3-phosphate 5-kinase type III ... SRP72 0.007 signal recognition particle 72kDa IFIT2 0.006 interferon-induced protein with tetratricopeptide r... APOD 0.005 apolipoprotein D precursor LCA5 0.005 Leber congenital amaurosis 5 LCA5 0.005 Leber congenital amaurosis 5Human BLASTP results (used to prepare the table) | |||
Gene descriptions are from NCBI RefSeq. Search results were obtained with NCBI BLAST and RefSeq entries. When identical proteins are present, the self-match may not be listed first in BLASTP output. In such cases, the table above has been reordered to place it first.
See About the Figures for the scoring system used in the figure above right. The same scoring system was used in the table of BLASTP results.
Guide to the Human Genome
Copyright © 2010 by Stewart Scherer. All rights reserved.
