
| Name: DNM1 | Sequence: fasta or formatted (851aa) | NCBI GI: 56549117 | |
|
Description: dynamin 1 isoform 2
|
Referenced in: Additional Brain Proteins
| ||
Other entries for this name:
alt prot [864aa] dynamin 1 isoform 1 | |||
|
Composition:
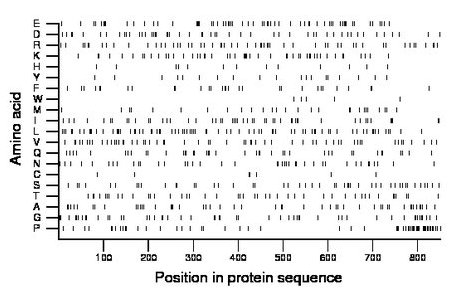
Amino acid Percentage Count Longest homopolymer A alanine 5.9 50 2 C cysteine 0.8 7 1 D aspartate 6.1 52 2 E glutamate 7.6 65 2 F phenylalanine 3.5 30 2 G glycine 6.0 51 2 H histidine 1.5 13 1 I isoleucine 5.9 50 2 K lysine 6.3 54 3 L leucine 8.9 76 2 M methionine 3.3 28 1 N asparagine 4.7 40 2 P proline 6.8 58 3 Q glutamine 4.8 41 2 R arginine 7.1 60 2 S serine 5.9 50 2 T threonine 5.4 46 3 V valine 6.6 56 2 W tryptophan 0.6 5 1 Y tyrosine 2.2 19 1 |
Comparative genomics:
Search single species RefSeq proteins at NCBI
Search summary 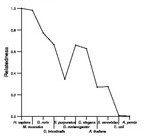
Figure data | ||
Related human proteins:Protein Relative score Description Self-match 1.000 dynamin 1 isoform 2 DNM1 0.992 dynamin 1 isoform 1 DNM2 0.800 dynamin 2 isoform 1 DNM2 0.794 dynamin 2 isoform 2 DNM2 0.794 dynamin 2 isoform 3 DNM3 0.789 dynamin 3 isoform a DNM2 0.788 dynamin 2 isoform 4 DNM3 0.787 dynamin 3 isoform b DNM1L 0.259 dynamin 1-like isoform 2 DNM1L 0.259 dynamin 1-like isoform 1 DNM1L 0.259 dynamin 1-like isoform 3 MX1 0.127 myxovirus resistance protein 1 MX1 0.127 myxovirus resistance protein 1 MX2 0.114 myxovirus resistance protein 2 LOC730058 0.082 PREDICTED: UPF0621 protein C-like LOC730058 0.082 PREDICTED: UPF0621 protein C-like LOC730058 0.082 PREDICTED: UPF0621 protein C-like LOC727858 0.058 PREDICTED: similar to dynamin 1 LOC100288331 0.053 PREDICTED: hypothetical protein XP_002343417 OPA1 0.049 optic atrophy 1 isoform 8 OPA1 0.049 optic atrophy 1 isoform 7 OPA1 0.049 optic atrophy 1 isoform 6 OPA1 0.049 optic atrophy 1 isoform 5 OPA1 0.049 optic atrophy 1 isoform 4 OPA1 0.049 optic atrophy 1 isoform 3 OPA1 0.049 optic atrophy 1 isoform 2 OPA1 0.049 optic atrophy 1 isoform 1 LOC100288161 0.047 PREDICTED: hypothetical protein XP_002343416 LOC100288036 0.047 PREDICTED: hypothetical protein XP_002343372 DIAPH1 0.021 diaphanous 1 isoform 2Human BLASTP results (used to prepare the table) | |||
Gene descriptions are from NCBI RefSeq. Search results were obtained with NCBI BLAST and RefSeq entries. When identical proteins are present, the self-match may not be listed first in BLASTP output. In such cases, the table above has been reordered to place it first.
See About the Figures for the scoring system used in the figure above right. The same scoring system was used in the table of BLASTP results.
Guide to the Human Genome
Copyright © 2010 by Stewart Scherer. All rights reserved.
