
| Name: OPA1 | Sequence: fasta or formatted (942aa) | NCBI GI: 18860833 | |
|
Description: optic atrophy 1 isoform 3
|
Referenced in: Additional Brain Proteins
| ||
Other entries for this name:
alt prot [924aa] optic atrophy 1 isoform 2 alt prot [961aa] optic atrophy 1 isoform 4 alt prot [979aa] optic atrophy 1 isoform 6 alt prot [960aa] optic atrophy 1 isoform 1 alt prot [978aa] optic atrophy 1 isoform 5 alt prot [997aa] optic atrophy 1 isoform 7 alt prot [1015aa] optic atrophy 1 isoform 8 | |||
|
Composition:
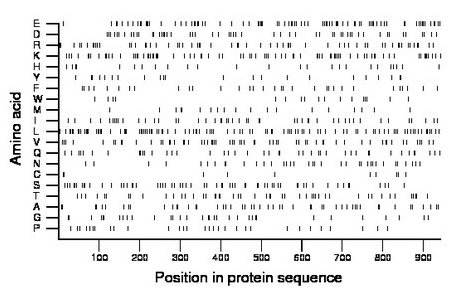
Amino acid Percentage Count Longest homopolymer A alanine 5.5 52 2 C cysteine 1.1 10 1 D aspartate 5.7 54 2 E glutamate 9.1 86 3 F phenylalanine 3.5 33 2 G glycine 3.7 35 3 H histidine 3.0 28 2 I isoleucine 5.3 50 2 K lysine 8.6 81 2 L leucine 10.7 101 5 M methionine 2.1 20 2 N asparagine 3.9 37 2 P proline 3.2 30 1 Q glutamine 5.0 47 2 R arginine 6.5 61 2 S serine 6.7 63 2 T threonine 5.3 50 2 V valine 6.7 63 4 W tryptophan 1.9 18 1 Y tyrosine 2.4 23 3 |
Comparative genomics:
Search single species RefSeq proteins at NCBI
Search summary 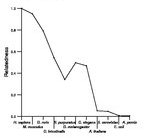
Figure data | ||
Related human proteins:Protein Relative score Description Self-match 1.000 optic atrophy 1 isoform 3 OPA1 0.990 optic atrophy 1 isoform 5 OPA1 0.990 optic atrophy 1 isoform 6 OPA1 0.981 optic atrophy 1 isoform 8 OPA1 0.977 optic atrophy 1 isoform 1 OPA1 0.977 optic atrophy 1 isoform 2 OPA1 0.967 optic atrophy 1 isoform 7 OPA1 0.967 optic atrophy 1 isoform 4 DNM2 0.048 dynamin 2 isoform 4 DNM2 0.048 dynamin 2 isoform 2 DNM2 0.048 dynamin 2 isoform 1 DNM2 0.048 dynamin 2 isoform 3 DNM1 0.044 dynamin 1 isoform 2 DNM1 0.044 dynamin 1 isoform 1 DNM1L 0.043 dynamin 1-like isoform 1 DNM1L 0.043 dynamin 1-like isoform 3 DNM1L 0.043 dynamin 1-like isoform 2 DNM3 0.042 dynamin 3 isoform a DNM3 0.042 dynamin 3 isoform b MX1 0.041 myxovirus resistance protein 1 MX1 0.041 myxovirus resistance protein 1 MX2 0.040 myxovirus resistance protein 2 CENPE 0.008 centromere protein E GOLGA4 0.008 golgi autoantigen, golgin subfamily a, 4 RB1CC1 0.008 Rb1-inducible coiled coil protein 1 isoform 2 [Homo... RB1CC1 0.008 Rb1-inducible coiled coil protein 1 isoform 1 [Homo... KRT73 0.008 keratin 73 KRT74 0.007 keratin 6 irs4 UACA 0.007 uveal autoantigen with coiled-coil domains and ankyr... UACA 0.007 uveal autoantigen with coiled-coil domains and ankyr...Human BLASTP results (used to prepare the table) | |||
Gene descriptions are from NCBI RefSeq. Search results were obtained with NCBI BLAST and RefSeq entries. When identical proteins are present, the self-match may not be listed first in BLASTP output. In such cases, the table above has been reordered to place it first.
See About the Figures for the scoring system used in the figure above right. The same scoring system was used in the table of BLASTP results.
Guide to the Human Genome
Copyright © 2010 by Stewart Scherer. All rights reserved.
