
| Name: GPR19 | Sequence: fasta or formatted (415aa) | NCBI GI: 5453666 | |
|
Description: G protein-coupled receptor 19
|
Referenced in:
| ||
|
Composition:
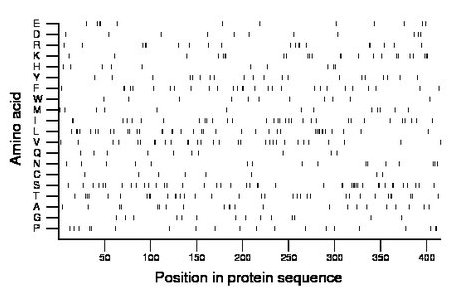
Amino acid Percentage Count Longest homopolymer A alanine 5.3 22 2 C cysteine 1.9 8 1 D aspartate 2.7 11 1 E glutamate 2.9 12 2 F phenylalanine 6.7 28 2 G glycine 3.4 14 1 H histidine 2.4 10 1 I isoleucine 7.7 32 2 K lysine 5.8 24 2 L leucine 9.2 38 2 M methionine 3.1 13 1 N asparagine 3.9 16 1 P proline 4.8 20 2 Q glutamine 2.4 10 1 R arginine 4.6 19 2 S serine 10.4 43 3 T threonine 8.2 34 2 V valine 7.2 30 2 W tryptophan 2.7 11 1 Y tyrosine 4.8 20 1 |
Comparative genomics:
Search single species RefSeq proteins at NCBI
Search summary 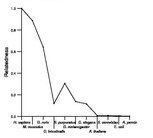
Figure data | ||
Related human proteins:Protein Relative score Description Self-match 1.000 G protein-coupled receptor 19 NPFFR2 0.141 neuropeptide FF receptor 2 isoform 2 NPFFR2 0.141 neuropeptide FF receptor 2 isoform 1 NPFFR2 0.141 neuropeptide FF receptor 2 isoform 3 GPR83 0.139 G protein-coupled receptor 83 HCRTR2 0.123 orexin receptor 2 GALR1 0.119 galanin receptor 1 NPFFR1 0.114 neuropeptide FF receptor 1 QRFPR 0.114 G protein-coupled receptor 103 GALR2 0.111 galanin receptor 2 NPY2R 0.111 neuropeptide Y receptor Y2 NPSR1 0.109 G protein-coupled receptor for asthma susceptibility... ADRB2 0.109 adrenergic, beta-2-, receptor, surface TACR2 0.109 tachykinin receptor 2 HCRTR1 0.108 orexin receptor 1 NPSR1 0.108 G protein-coupled receptor for asthma susceptibility... SSTR2 0.107 somatostatin receptor 2 SSTR1 0.101 somatostatin receptor 1 SSTR5 0.099 somatostatin receptor 5 KISS1R 0.099 G protein-coupled receptor 54 TAAR2 0.097 trace amine associated receptor 2 isoform 1 TACR3 0.096 tachykinin receptor 3 OPRM1 0.095 opioid receptor, mu 1 isoform MOR-1B5 TAAR2 0.095 trace amine associated receptor 2 isoform 2 PRLHR 0.095 G protein-coupled receptor 10 HRH2 0.095 histamine receptor H2 isoform 1 HRH2 0.095 histamine receptor H2 isoform 2 SSTR4 0.094 somatostatin receptor 4 OPRM1 0.092 opioid receptor, mu 1 isoform MOR-1B2 TACR1 0.092 tachykinin receptor 1 isoform longHuman BLASTP results (used to prepare the table) | |||
Gene descriptions are from NCBI RefSeq. Search results were obtained with NCBI BLAST and RefSeq entries. When identical proteins are present, the self-match may not be listed first in BLASTP output. In such cases, the table above has been reordered to place it first.
See About the Figures for the scoring system used in the figure above right. The same scoring system was used in the table of BLASTP results.
Guide to the Human Genome
Copyright © 2010 by Stewart Scherer. All rights reserved.
