
| Name: TAAR2 | Sequence: fasta or formatted (351aa) | NCBI GI: 74275344 | |
|
Description: trace amine associated receptor 2 isoform 1
|
Referenced in:
| ||
Other entries for this name:
alt prot [306aa] trace amine associated receptor 2 isoform 2 | |||
|
Composition:
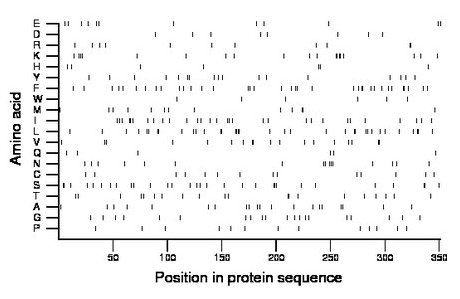
Amino acid Percentage Count Longest homopolymer A alanine 5.7 20 2 C cysteine 4.0 14 1 D aspartate 2.3 8 1 E glutamate 3.4 12 1 F phenylalanine 10.3 36 2 G glycine 5.7 20 1 H histidine 2.0 7 1 I isoleucine 8.5 30 2 K lysine 5.4 19 2 L leucine 10.0 35 4 M methionine 3.7 13 2 N asparagine 4.6 16 2 P proline 3.7 13 1 Q glutamine 1.7 6 1 R arginine 3.1 11 2 S serine 8.5 30 3 T threonine 5.7 20 2 V valine 5.1 18 2 W tryptophan 1.7 6 1 Y tyrosine 4.8 17 2 |
Comparative genomics:
Search single species RefSeq proteins at NCBI
Search summary 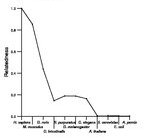
Figure data | ||
Related human proteins:Protein Relative score Description Self-match 1.000 trace amine associated receptor 2 isoform 1 TAAR2 0.870 trace amine associated receptor 2 isoform 2 TAAR1 0.431 trace amine associated receptor 1 TAAR5 0.371 trace amine associated receptor 5 TAAR6 0.341 trace amine associated receptor 6 TAAR9 0.341 trace amine associated receptor 9 TAAR8 0.321 trace amine associated receptor 8 HTR4 0.238 serotonin 5-HT4 receptor isoform n HTR4 0.238 serotonin 5-HT4 receptor isoform i HTR4 0.238 serotonin 5-HT4 receptor isoform d HTR4 0.238 serotonin 5-HT4 receptor isoform a HTR4 0.238 serotonin 5-HT4 receptor isoform g HTR4 0.238 serotonin 5-HT4 receptor isoform b HTR4 0.237 serotonin 5-HT4 receptor isoform hb ADRA1A 0.175 alpha-1A-adrenergic receptor isoform 4 ADRA1A 0.175 alpha-1A-adrenergic receptor isoform 1 ADRA1A 0.175 alpha-1A-adrenergic receptor isoform 2 ADRA1A 0.175 alpha-1A-adrenergic receptor isoform 3 HRH2 0.171 histamine receptor H2 isoform 1 HRH2 0.171 histamine receptor H2 isoform 2 ADRA1B 0.171 alpha-1B-adrenergic receptor DRD1 0.167 dopamine receptor D1 HTR1D 0.165 5-hydroxytryptamine (serotonin) receptor 1D ADRB2 0.163 adrenergic, beta-2-, receptor, surface HTR7 0.151 5-hydroxytryptamine receptor 7 isoform b HTR7 0.151 5-hydroxytryptamine receptor 7 isoform d HTR7 0.151 5-hydroxytryptamine receptor 7 isoform a HTR1E 0.143 5-hydroxytryptamine (serotonin) receptor 1E ADRB3 0.137 adrenergic, beta-3-, receptor NPFFR2 0.134 neuropeptide FF receptor 2 isoform 2Human BLASTP results (used to prepare the table) | |||
Gene descriptions are from NCBI RefSeq. Search results were obtained with NCBI BLAST and RefSeq entries. When identical proteins are present, the self-match may not be listed first in BLASTP output. In such cases, the table above has been reordered to place it first.
See About the Figures for the scoring system used in the figure above right. The same scoring system was used in the table of BLASTP results.
Guide to the Human Genome
Copyright © 2010 by Stewart Scherer. All rights reserved.
