
| Name: FAM90A9 | Sequence: fasta or formatted (464aa) | NCBI GI: 51466913 | |
|
Description: PREDICTED: hypothetical protein
| Not currently referenced in the text | ||
|
Composition:
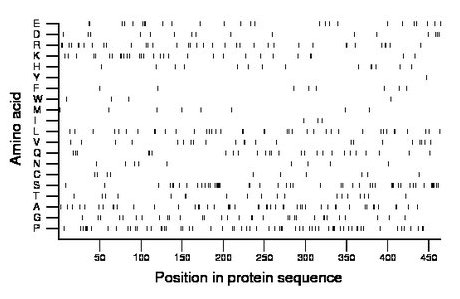
Amino acid Percentage Count Longest homopolymer A alanine 10.3 48 3 C cysteine 2.2 10 1 D aspartate 3.4 16 1 E glutamate 5.6 26 2 F phenylalanine 1.7 8 1 G glycine 6.9 32 2 H histidine 3.0 14 2 I isoleucine 0.6 3 1 K lysine 6.5 30 2 L leucine 8.4 39 2 M methionine 1.9 9 2 N asparagine 1.9 9 1 P proline 13.6 63 3 Q glutamine 5.6 26 2 R arginine 7.8 36 2 S serine 10.6 49 5 T threonine 4.1 19 2 V valine 4.7 22 2 W tryptophan 0.9 4 1 Y tyrosine 0.2 1 1 |
Comparative genomics:
Search single species RefSeq proteins at NCBI
Search summary 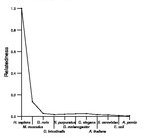
Figure data | ||
Related human proteins:Protein Relative score Description Self-match 1.000 PREDICTED: hypothetical protein FAM90A19 0.989 PREDICTED: hypothetical protein FAM90A18 0.989 PREDICTED: hypothetical protein LOC441326 FAM90A8 0.988 PREDICTED: hypothetical protein FAM90A15 0.982 PREDICTED: hypothetical protein LOC389630 FAM90A14 0.978 PREDICTED: hypothetical protein FAM90A13 0.978 PREDICTED: hypothetical protein FAM90A3 0.977 PREDICTED: hypothetical protein FAM90A5 0.976 PREDICTED: hypothetical protein FAM90A10 0.975 PREDICTED: hypothetical protein LOC441328 FAM90A12 0.974 PREDICTED: hypothetical protein FAM90A7 0.974 hypothetical protein LOC441317 FAM90A20 0.942 PREDICTED: hypothetical protein FAM90A20 0.938 PREDICTED: hypothetical protein LOC100287045 0.932 PREDICTED: hypothetical protein XP_002342469 isofor... LOC100287045 0.932 PREDICTED: hypothetical protein XP_002342468 isofor... FAM90A1 0.915 hypothetical protein LOC55138 LOC646508 0.217 PREDICTED: hypothetical LOC646508 LOC646508 0.217 PREDICTED: hypothetical LOC646508 LOC646508 0.163 PREDICTED: hypothetical LOC646508 FLJ22184 0.029 PREDICTED: hypothetical protein LOC80164 FLJ22184 0.027 PREDICTED: hypothetical protein FLJ22184 MLL2 0.027 myeloid/lymphoid or mixed-lineage leukemia 2 FLJ22184 0.026 PREDICTED: hypothetical protein FLJ22184 NACA 0.026 nascent polypeptide-associated complex alpha subuni... PCLO 0.025 piccolo isoform 2 PCLO 0.025 piccolo isoform 1 FSCB 0.024 fibrous sheath CABYR binding protein ATN1 0.023 atrophin-1 ATN1 0.023 atrophin-1Human BLASTP results (used to prepare the table) | |||
Gene descriptions are from NCBI RefSeq. Search results were obtained with NCBI BLAST and RefSeq entries. When identical proteins are present, the self-match may not be listed first in BLASTP output. In such cases, the table above has been reordered to place it first.
See About the Figures for the scoring system used in the figure above right. The same scoring system was used in the table of BLASTP results.
Guide to the Human Genome
Copyright © 2010 by Stewart Scherer. All rights reserved.
