
| Name: ROM1 | Sequence: fasta or formatted (351aa) | NCBI GI: 4506575 | |
|
Description: retinal outer segment membrane protein 1
|
Referenced in: Crystallins and Other Eye Proteins
| ||
|
Composition:
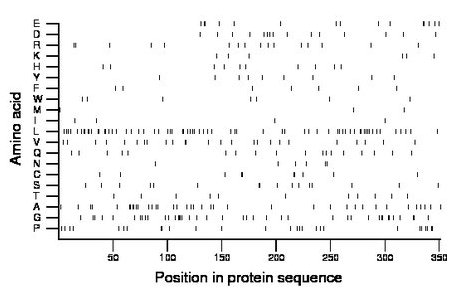
Amino acid Percentage Count Longest homopolymer A alanine 10.8 38 2 C cysteine 2.8 10 2 D aspartate 4.3 15 1 E glutamate 4.3 15 2 F phenylalanine 2.0 7 1 G glycine 11.7 41 4 H histidine 2.8 10 1 I isoleucine 1.1 4 1 K lysine 1.7 6 1 L leucine 19.1 67 2 M methionine 0.9 3 1 N asparagine 1.7 6 1 P proline 7.7 27 2 Q glutamine 5.1 18 1 R arginine 4.6 16 1 S serine 4.6 16 2 T threonine 3.1 11 1 V valine 7.1 25 2 W tryptophan 2.0 7 1 Y tyrosine 2.6 9 1 |
Comparative genomics:
Search single species RefSeq proteins at NCBI
Search summary 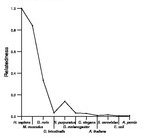
Figure data | ||
Related human proteins:Protein Relative score Description Self-match 1.000 retinal outer segment membrane protein 1 PRPH2 0.299 peripherin 2 TSPAN10 0.040 tetraspanin 10 CD151 0.036 CD151 antigen CD151 0.036 CD151 antigen CD151 0.036 CD151 antigen CD151 0.036 CD151 antigen TSPAN3 0.035 transmembrane 4 superfamily member 8 isoform 1 TSPAN3 0.035 transmembrane 4 superfamily member 8 isoform 2 [Homo... TSPAN15 0.022 transmembrane 4 superfamily member 15 TSPAN33 0.020 tetraspanin 33 TSPAN11 0.014 tetraspanin 11 TAOK2 0.013 TAO kinase 2 isoform 2 TSPAN9 0.012 tetraspanin 9 TSPAN14 0.012 tetraspanin 14 isoform 1 LOC100292048 0.012 PREDICTED: hypothetical protein XP_002344877 LOC100289126 0.012 PREDICTED: hypothetical protein XP_002343381 LOC100293229 0.010 PREDICTED: hypothetical protein LOC100288716 0.010 PREDICTED: hypothetical protein LOC100288716 0.010 PREDICTED: hypothetical protein XP_002342991 TSPAN4 0.010 tetraspanin 4 isoform a TSPAN4 0.010 tetraspanin 4 isoform a TSPAN4 0.010 tetraspanin 4 isoform a TSPAN4 0.010 tetraspanin 4 isoform a TSPAN4 0.010 tetraspanin 4 isoform a TSPAN4 0.010 tetraspanin 4 isoform a TSPAN6 0.009 transmembrane 4 superfamily member 6 DCAF12L2 0.009 DDB1 and CUL4 associated factor 12-like 2 SLC12A5 0.009 solute carrier family 12 (potassium-chloride transp... SLC12A5 0.009 solute carrier family 12 (potassium-chloride transpo...Human BLASTP results (used to prepare the table) | |||
Gene descriptions are from NCBI RefSeq. Search results were obtained with NCBI BLAST and RefSeq entries. When identical proteins are present, the self-match may not be listed first in BLASTP output. In such cases, the table above has been reordered to place it first.
See About the Figures for the scoring system used in the figure above right. The same scoring system was used in the table of BLASTP results.
Guide to the Human Genome
Copyright © 2010 by Stewart Scherer. All rights reserved.
