
| Name: MEIS1 | Sequence: fasta or formatted (390aa) | NCBI GI: 4505151 | |
|
Description: Meis homeobox 1
|
Referenced in:
| ||
|
Composition:
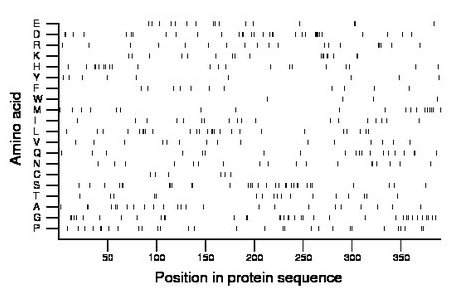
Amino acid Percentage Count Longest homopolymer A alanine 6.2 24 2 C cysteine 1.5 6 1 D aspartate 8.5 33 4 E glutamate 4.1 16 2 F phenylalanine 2.8 11 1 G glycine 9.2 36 2 H histidine 5.4 21 2 I isoleucine 4.6 18 1 K lysine 4.4 17 2 L leucine 6.7 26 2 M methionine 4.9 19 1 N asparagine 4.6 18 2 P proline 7.4 29 2 Q glutamine 5.1 20 2 R arginine 4.9 19 3 S serine 8.2 32 2 T threonine 4.4 17 1 V valine 3.8 15 1 W tryptophan 1.0 4 1 Y tyrosine 2.3 9 1 |
Comparative genomics:
Search single species RefSeq proteins at NCBI
Search summary 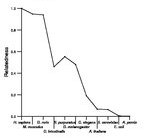
Figure data | ||
Related human proteins:Protein Relative score Description Self-match 1.000 Meis homeobox 1 MEIS2 0.854 Meis homeobox 2 isoform b MEIS2 0.845 Meis homeobox 2 isoform a MEIS2 0.819 Meis homeobox 2 isoform f MEIS2 0.812 Meis homeobox 2 isoform g MEIS2 0.807 Meis homeobox 2 isoform d MEIS2 0.798 Meis homeobox 2 isoform c MEIS2 0.671 Meis homeobox 2 isoform h MEIS3 0.565 Meis1, myeloid ecotropic viral integration site 1 ho... MEIS3 0.533 Meis1, myeloid ecotropic viral integration site 1 ho... PKNOX2 0.253 PBX/knotted 1 homeobox 2 PKNOX1 0.236 PBX/knotted 1 homeobox 1 TGIF2LX 0.065 TGFB-induced factor homeobox 2-like, X-linked TGIF2LY 0.063 TGFB-induced factor homeobox 2-like, Y-linked TGIF1 0.062 TG-interacting factor isoform b TGIF1 0.062 TG-interacting factor isoform a TGIF1 0.062 TG-interacting factor isoform c TGIF1 0.062 TG-interacting factor isoform d TGIF1 0.062 TG-interacting factor isoform d TGIF1 0.062 TG-interacting factor isoform d TGIF1 0.062 TG-interacting factor isoform d TGIF1 0.062 TG-interacting factor isoform c TGIF2 0.060 TGFB-induced factor homeobox 2 PBX4 0.049 pre-B-cell leukemia homeobox 4 PBX2 0.048 pre-B-cell leukemia homeobox 2 PBX1 0.048 pre-B-cell leukemia homeobox 1 PBX3 0.045 pre-B-cell leukemia homeobox 3 isoform 2 PBX3 0.045 pre-B-cell leukemia homeobox 3 isoform 1 MKX 0.039 mohawk homeobox IRX2 0.036 iroquois homeobox 2Human BLASTP results (used to prepare the table) | |||
Gene descriptions are from NCBI RefSeq. Search results were obtained with NCBI BLAST and RefSeq entries. When identical proteins are present, the self-match may not be listed first in BLASTP output. In such cases, the table above has been reordered to place it first.
See About the Figures for the scoring system used in the figure above right. The same scoring system was used in the table of BLASTP results.
Guide to the Human Genome
Copyright © 2010 by Stewart Scherer. All rights reserved.
