
| Name: LYL1 | Sequence: fasta or formatted (280aa) | NCBI GI: 34147558 | |
|
Description: lymphoblastic leukemia derived sequence 1
|
Referenced in: T cells
| ||
|
Composition:
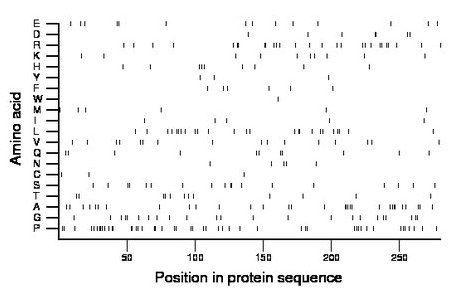
Amino acid Percentage Count Longest homopolymer A alanine 11.1 31 3 C cysteine 1.1 3 1 D aspartate 2.5 7 2 E glutamate 5.0 14 2 F phenylalanine 2.1 6 1 G glycine 8.2 23 2 H histidine 3.2 9 1 I isoleucine 1.8 5 1 K lysine 3.6 10 1 L leucine 8.9 25 2 M methionine 2.1 6 1 N asparagine 1.8 5 1 P proline 17.1 48 3 Q glutamine 3.9 11 2 R arginine 9.6 27 2 S serine 6.4 18 2 T threonine 4.3 12 2 V valine 5.7 16 1 W tryptophan 0.4 1 1 Y tyrosine 1.1 3 1 |
Comparative genomics:
Search single species RefSeq proteins at NCBI
Search summary 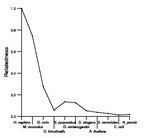
Figure data | ||
Related human proteins:Protein Relative score Description Self-match 1.000 lymphoblastic leukemia derived sequence 1 TAL1 0.211 T-cell acute lymphocytic leukemia 1 TAL2 0.139 T-cell acute lymphocytic leukemia 2 ATOH8 0.076 atonal homolog 8 TCF15 0.072 basic helix-loop-helix transcription factor 15 [Homo... HAND2 0.067 basic helix-loop-helix transcription factor HAND2 [H... SCXB 0.067 scleraxis homolog B SCXA 0.067 scleraxis homolog A NHLH2 0.065 nescient helix loop helix 2 NHLH2 0.065 nescient helix loop helix 2 NHLH1 0.065 nescient helix loop helix 1 NEUROG1 0.063 neurogenin 1 ATOH1 0.063 atonal homolog 1 NEUROG2 0.063 neurogenin 2 TWIST1 0.061 twist TWIST2 0.061 twist homolog 2 ASCL5 0.060 PREDICTED: achaete-scute complex homolog 5 (Drosoph... ASCL5 0.060 PREDICTED: achaete-scute complex homolog 5 (Drosoph... ASCL5 0.060 PREDICTED: achaete-scute complex homolog 5 BHLHA15 0.058 basic helix-loop-helix family, member a15 LOC100129654 0.056 PREDICTED: similar to transcription factor 23 [Homo... LOC100129654 0.056 PREDICTED: similar to transcription factor 23 [Homo... NEUROG3 0.054 neurogenin 3 PTF1A 0.054 pancreas specific transcription factor, 1a MNT 0.054 MAX binding protein LOC100129654 0.054 PREDICTED: similar to transcription factor 23 [Homo... ATOH7 0.054 atonal homolog 7 HAND1 0.051 basic helix-loop-helix transcription factor HAND1 [Ho... ASCL2 0.051 achaete-scute complex homolog-like 2 MYOD1 0.049 myogenic differentiation 1Human BLASTP results (used to prepare the table) | |||
Gene descriptions are from NCBI RefSeq. Search results were obtained with NCBI BLAST and RefSeq entries. When identical proteins are present, the self-match may not be listed first in BLASTP output. In such cases, the table above has been reordered to place it first.
See About the Figures for the scoring system used in the figure above right. The same scoring system was used in the table of BLASTP results.
Guide to the Human Genome
Copyright © 2010 by Stewart Scherer. All rights reserved.
