
| Name: EBF1 | Sequence: fasta or formatted (591aa) | NCBI GI: 31415878 | |
|
Description: early B-cell factor
|
Referenced in: B cells
| ||
|
Composition:
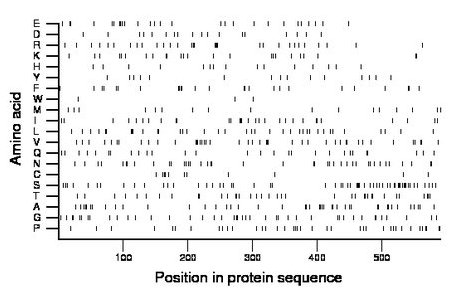
Amino acid Percentage Count Longest homopolymer A alanine 7.3 43 2 C cysteine 1.9 11 2 D aspartate 3.0 18 1 E glutamate 4.6 27 2 F phenylalanine 4.4 26 2 G glycine 7.3 43 2 H histidine 2.5 15 1 I isoleucine 5.1 30 3 K lysine 4.1 24 2 L leucine 6.3 37 2 M methionine 3.2 19 2 N asparagine 6.8 40 2 P proline 6.9 41 3 Q glutamine 4.7 28 2 R arginine 5.2 31 2 S serine 10.2 60 4 T threonine 6.3 37 2 V valine 7.3 43 3 W tryptophan 0.5 3 1 Y tyrosine 2.5 15 1 |
Comparative genomics:
Search single species RefSeq proteins at NCBI
Search summary 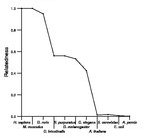
Figure data | ||
Related human proteins:Protein Relative score Description Self-match 1.000 early B-cell factor EBF3 0.828 early B-cell factor 3 EBF2 0.773 early B-cell factor 2 EBF4 0.735 early B-cell factor 4 ANKHD1 0.016 ankyrin repeat and KH domain containing 1 isoform 1 ... ANKHD1-EIF4EBP3 0.016 ANKHD1-EIF4EBP3 protein MUC3A 0.015 PREDICTED: mucin 3A, cell surface associated, parti... MUC3B 0.015 PREDICTED: mucin 3B, cell surface associated, parti... MUC3A 0.015 PREDICTED: mucin 3A, intestinal ANKRD17 0.015 ankyrin repeat domain protein 17 isoform a ANKRD17 0.015 ankyrin repeat domain protein 17 isoform b MUC21 0.013 mucin 21 CRTC3 0.013 transducer of regulated CREB protein 3 isoform b [H... CRTC3 0.013 transducer of regulated CREB protein 3 isoform a [H... MUC12 0.012 PREDICTED: mucin 12 TNRC18 0.012 trinucleotide repeat containing 18 MUC17 0.012 mucin 17 SIX4 0.012 sine oculis homeobox homolog 4 AHDC1 0.011 AT hook, DNA binding motif, containing 1 C13orf23 0.010 hypothetical protein LOC80209 isoform 2 C13orf23 0.010 hypothetical protein LOC80209 isoform 1 NUP214 0.010 nucleoporin 214kDa LOC100133915 0.010 PREDICTED: hypothetical protein LOC729792 0.010 PREDICTED: hypothetical protein LOC100294136 0.010 PREDICTED: hypothetical protein LOC100294091 0.010 PREDICTED: hypothetical protein UBAP2 0.010 ubiquitin associated protein 2 MUC16 0.009 mucin 16 MUC12 0.009 PREDICTED: mucin 12 PHF2 0.009 PHD finger protein 2Human BLASTP results (used to prepare the table) | |||
Gene descriptions are from NCBI RefSeq. Search results were obtained with NCBI BLAST and RefSeq entries. When identical proteins are present, the self-match may not be listed first in BLASTP output. In such cases, the table above has been reordered to place it first.
See About the Figures for the scoring system used in the figure above right. The same scoring system was used in the table of BLASTP results.
Guide to the Human Genome
Copyright © 2010 by Stewart Scherer. All rights reserved.
