
| Name: PSME2 | Sequence: fasta or formatted (239aa) | NCBI GI: 30410792 | |
|
Description: proteasome activator subunit 2
|
Referenced in:
| ||
|
Composition:
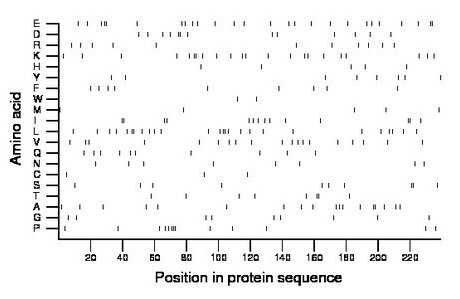
Amino acid Percentage Count Longest homopolymer A alanine 7.5 18 2 C cysteine 1.3 3 1 D aspartate 5.4 13 2 E glutamate 10.9 26 2 F phenylalanine 3.8 9 1 G glycine 3.8 9 1 H histidine 2.1 5 1 I isoleucine 5.9 14 2 K lysine 9.2 22 2 L leucine 10.9 26 2 M methionine 2.1 5 1 N asparagine 3.3 8 1 P proline 5.4 13 3 Q glutamine 4.2 10 1 R arginine 4.6 11 1 S serine 4.2 10 2 T threonine 3.3 8 2 V valine 7.9 19 1 W tryptophan 0.8 2 1 Y tyrosine 3.3 8 1 |
Comparative genomics:
Search single species RefSeq proteins at NCBI
Search summary 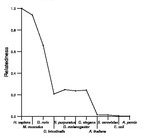
Figure data | ||
Related human proteins:Protein Relative score Description Self-match 1.000 proteasome activator subunit 2 PSME1 0.440 proteasome activator subunit 1 isoform 1 PSME1 0.387 proteasome activator subunit 1 isoform 2 PSME3 0.305 proteasome activator subunit 3 isoform 1 PSME3 0.288 proteasome activator subunit 3 isoform 2 EXT2 0.015 exostosin 2 isoform 2 EXT2 0.015 exostosin 2 isoform 1 MYH2 0.015 myosin, heavy chain 2, skeletal muscle, adult [Homo... MYH2 0.015 myosin, heavy chain 2, skeletal muscle, adult [Homo... PLEKHA7 0.013 pleckstrin homology domain containing, family A mem... MYH8 0.011 myosin, heavy chain 8, skeletal muscle, perinatal [... SPEF2 0.009 KPL2 protein isoform 1 SP110 0.009 SP110 nuclear body protein isoform a SP110 0.009 SP110 nuclear body protein isoform b SP110 0.009 SP110 nuclear body protein isoform c MYPN 0.009 myopalladin GOLGB1 0.009 golgi autoantigen, golgin subfamily b, macrogolgin ... HECTD1 0.009 HECT domain containing 1 SRRM1 0.009 serine/arginine repetitive matrix 1 ITSN1 0.007 intersectin 1 isoform ITSN-s ITSN1 0.007 intersectin 1 isoform ITSN-l ALPK1 0.007 alpha-kinase 1 ALPK1 0.007 alpha-kinase 1 PLEKHH1 0.007 pleckstrin homology domain containing, family H (wit... PNMAL2 0.007 PNMA-like 2 AMPD3 0.007 adenosine monophosphate deaminase 3 isoform 1A ZNF518A 0.007 zinc finger protein 518 CCDC150 0.007 coiled-coil domain containing 150 DIAPH3 0.007 diaphanous homolog 3 isoform b DIAPH3 0.007 diaphanous homolog 3 isoform aHuman BLASTP results (used to prepare the table) | |||
Gene descriptions are from NCBI RefSeq. Search results were obtained with NCBI BLAST and RefSeq entries. When identical proteins are present, the self-match may not be listed first in BLASTP output. In such cases, the table above has been reordered to place it first.
See About the Figures for the scoring system used in the figure above right. The same scoring system was used in the table of BLASTP results.
Guide to the Human Genome
Copyright © 2010 by Stewart Scherer. All rights reserved.
