
| Name: MAGEF1 | Sequence: fasta or formatted (307aa) | NCBI GI: 29826296 | |
|
Description: melanoma antigen family F, 1
|
Referenced in:
| ||
|
Composition:
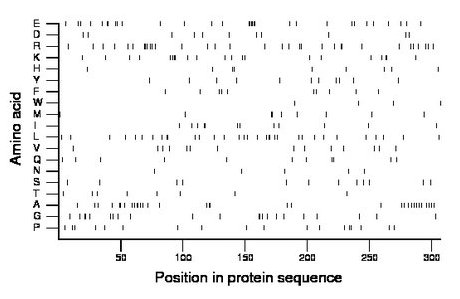
Amino acid Percentage Count Longest homopolymer A alanine 10.7 33 2 C cysteine 0.0 0 0 D aspartate 3.6 11 1 E glutamate 10.1 31 6 F phenylalanine 3.3 10 1 G glycine 7.2 22 2 H histidine 2.9 9 2 I isoleucine 3.9 12 2 K lysine 6.8 21 3 L leucine 10.7 33 2 M methionine 2.9 9 2 N asparagine 1.6 5 1 P proline 5.9 18 2 Q glutamine 3.6 11 2 R arginine 10.7 33 3 S serine 3.9 12 1 T threonine 2.6 8 1 V valine 4.6 14 1 W tryptophan 1.3 4 1 Y tyrosine 3.6 11 1 |
Comparative genomics:
Search single species RefSeq proteins at NCBI
Search summary 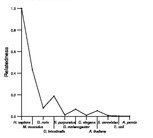
Figure data | ||
Related human proteins:Protein Relative score Description Self-match 1.000 melanoma antigen family F, 1 NDNL2 0.460 necdin-like 2 MAGEE1 0.342 melanoma antigen family E, 1 MAGED2 0.332 melanoma antigen family D, 2 MAGED2 0.332 melanoma antigen family D, 2 MAGED2 0.332 melanoma antigen family D, 2 TRO 0.299 trophinin isoform 5 MAGED1 0.296 melanoma antigen family D, 1 isoform a MAGED1 0.296 melanoma antigen family D, 1 isoform b MAGED1 0.296 melanoma antigen family D, 1 isoform b MAGEB18 0.294 melanoma antigen family B, 18 MAGEL2 0.291 MAGE-like protein 2 TRO 0.289 trophinin isoform 2 TRO 0.289 trophinin isoform 2 MAGEB17 0.283 PREDICTED: melanoma antigen family B, 17 MAGEB17 0.283 PREDICTED: melanoma antigen family B, 17 MAGEB17 0.283 PREDICTED: melanoma antigen family B, 17 MAGEB4 0.283 melanoma antigen family B, 4 MAGEB10 0.279 melanoma antigen family B, 10 MAGEB16 0.274 melanoma antigen family B, 16 MAGEB2 0.266 melanoma antigen family B, 2 MAGED4B 0.264 melanoma antigen family D, 4B isoform 2 MAGED4B 0.264 melanoma antigen family D, 4B isoform 1 MAGED4B 0.264 melanoma antigen family D, 4B isoform 1 MAGED4 0.264 melanoma antigen family D, 4 NDN 0.262 necdin MAGEB3 0.257 melanoma antigen family B, 3 MAGEB1 0.254 melanoma antigen family B, 1 MAGEB1 0.254 melanoma antigen family B, 1 MAGEB1 0.254 melanoma antigen family B, 1Human BLASTP results (used to prepare the table) | |||
Gene descriptions are from NCBI RefSeq. Search results were obtained with NCBI BLAST and RefSeq entries. When identical proteins are present, the self-match may not be listed first in BLASTP output. In such cases, the table above has been reordered to place it first.
See About the Figures for the scoring system used in the figure above right. The same scoring system was used in the table of BLASTP results.
Guide to the Human Genome
Copyright © 2010 by Stewart Scherer. All rights reserved.
