
| Name: MAGEB10 | Sequence: fasta or formatted (347aa) | NCBI GI: 73623441 | |
|
Description: melanoma antigen family B, 10
|
Referenced in:
| ||
|
Composition:
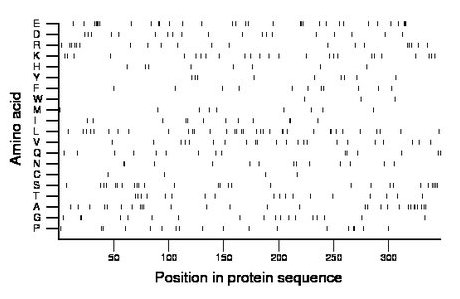
Amino acid Percentage Count Longest homopolymer A alanine 8.1 28 2 C cysteine 1.2 4 1 D aspartate 5.5 19 1 E glutamate 9.5 33 5 F phenylalanine 3.2 11 1 G glycine 5.2 18 2 H histidine 2.3 8 1 I isoleucine 3.5 12 2 K lysine 7.2 25 1 L leucine 10.1 35 2 M methionine 2.6 9 1 N asparagine 3.7 13 2 P proline 5.2 18 2 Q glutamine 4.3 15 2 R arginine 5.8 20 2 S serine 7.8 27 2 T threonine 5.2 18 1 V valine 6.3 22 1 W tryptophan 0.9 3 1 Y tyrosine 2.6 9 1 |
Comparative genomics:
Search single species RefSeq proteins at NCBI
Search summary 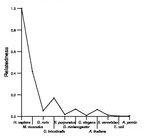
Figure data | ||
Related human proteins:Protein Relative score Description Self-match 1.000 melanoma antigen family B, 10 MAGEB4 0.473 melanoma antigen family B, 4 MAGEB18 0.465 melanoma antigen family B, 18 MAGEB1 0.455 melanoma antigen family B, 1 MAGEB1 0.455 melanoma antigen family B, 1 MAGEB1 0.455 melanoma antigen family B, 1 LOC392435 0.447 PREDICTED: similar to hCG1811022 LOC392435 0.447 PREDICTED: similar to hCG1811022 LOC392435 0.447 PREDICTED: similar to hCG1811022 MAGEB3 0.423 melanoma antigen family B, 3 MAGEB17 0.407 PREDICTED: melanoma antigen family B, 17 MAGEB17 0.407 PREDICTED: melanoma antigen family B, 17 MAGEB17 0.407 PREDICTED: melanoma antigen family B, 17 MAGEA10 0.407 melanoma antigen family A, 10 MAGEA10 0.407 melanoma antigen family A, 10 MAGEB2 0.395 melanoma antigen family B, 2 MAGEB16 0.384 melanoma antigen family B, 16 LOC100292575 0.338 PREDICTED: similar to melanoma antigen family C, 2 ... MAGEB5 0.335 PREDICTED: melanoma antigen family B, 5 MAGEB5 0.335 PREDICTED: melanoma antigen family B, 5 MAGEB5 0.335 PREDICTED: melanoma antigen family B, 5 MAGEA8 0.335 melanoma antigen family A, 8 MAGEA9B 0.332 melanoma antigen family A, 9 -like MAGEA9 0.332 melanoma antigen family A, 9 MAGEA11 0.329 melanoma antigen family A, 11 isoform b MAGEA11 0.329 melanoma antigen family A, 11 isoform a MAGEC2 0.324 melanoma antigen family C, 2 MAGEC1 0.306 melanoma antigen family C, 1 LOC392555 0.303 PREDICTED: similar to melanoma antigen family C, 2 ... LOC392555 0.303 PREDICTED: similar to melanoma antigen family C, 2 ...Human BLASTP results (used to prepare the table) | |||
Gene descriptions are from NCBI RefSeq. Search results were obtained with NCBI BLAST and RefSeq entries. When identical proteins are present, the self-match may not be listed first in BLASTP output. In such cases, the table above has been reordered to place it first.
See About the Figures for the scoring system used in the figure above right. The same scoring system was used in the table of BLASTP results.
Guide to the Human Genome
Copyright © 2010 by Stewart Scherer. All rights reserved.
